TIB: Today I Bought (and Sold) - An Investors Journal #337 - Marijuana, S&P 500, US Tech, US Semiconductors, Europe, Russia, Gold, US Retail
Markets took a breather and my thinking shifted to profit taking and hedge making and a little bottom fishing ahead of the holidays.

Portfolio News
Market Selloff
Markets wanted to go up - sort of
Europe and US futures opened higher and the markets followed. Some key factors for me was S&P 500 respected the 2532 lows and closed above them at 2546. The encouraging part of this is it happened against a backdrop of oil price sliding below $50 over the last two days - energy is around 6% of the index. Markets really do want to break higher but there is not a lot of commitment. The headlines are saying exactly that and markets are waiting for the Federal Reserve.

Oil price collapse is a bit of a worry with mixed messages coming about whether it is a supply overload or a demand shortage Market sentiment is leaning to supply. Otherwise stock indices would have followed oil down harder (like they did in Europe - its index is closer to 12% energy)
Cannabis Carnival
Tilray, Inc (TLRY) announced a global supply and distribution agreement with Swiss drugmaker Novartis (NOVN.VX) to supply non-smokable and non-combustible medical cannabis products where it is legally allowed. As it happens it is legally allowed in Switzerland.

Bought
Tilray, Inc (TLRY): Canadian Marijuana. I have been waiting for a price catalyst to average down my entry price on Tilray. That arrived with the Novartis deal and I increased my holding. My first holding was a nibble - I increased the holding 3 times. As it happens I am also invested in Novartis whose share price dropped 1.3%.
Cisco Systems, Inc (CSCO): US Technology. Market has become a stock pickers market and I am leaning to picking industry stalwarts that are making transformations. Cisco is in the middle of its change programme and last earnings were encouraging. I am already invested in a few bull call spreads one of which is in-the-money. In this portfolio I added a small stock position - dividend yield 2.88%
A quick review of the chart presented in TIB242 shows that the pink arrow price scenario I modelled last time has a chance of playing out from the current consolidation.

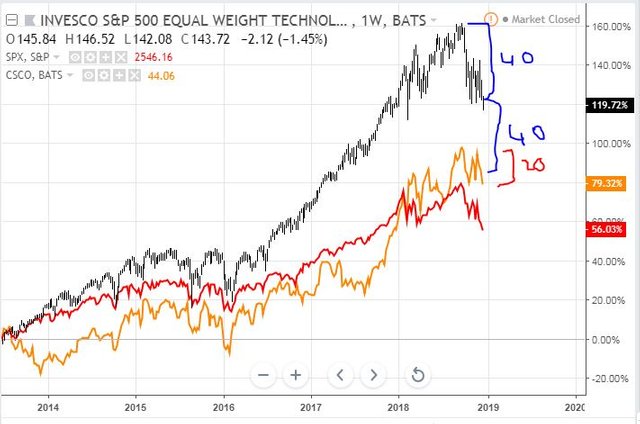
I also compared Cisco in TIB242 to its sector using the Invesco Equal Weighted Technology ETF (RYT - black bars) and was looking for CSCO (orange line) to close the gap which was 25 points at the time - the gap is now wider at 40 points but the key is that in the selloff the sector has dropped 40 points and Cisco has only dropped 20.
Five Below, Inc (FIVE): US Retail. Five Below is a speciality retail store focused on young buyers. I averaged down my entry price when Jim Cramer opened new positions in the Action Plus portfolio. See TIB318 for the purchase rationale then
QUALCOMM Incorporated (QCOM): US Semiconductors. Following the China court ruling blocking iPhone sales which infringe Qualcomm patents, I have had a bid open on QCOM options. That bid was hit after I increased the offer a bit. Bought a January 2021 57.5/67.5 bull call spread for net premium of $4.10 (7% of closing price $57.78) offering maximum profit potential of 144% if price passes $67.5 in the next 25 months. See TIB334 for the discussion about the court ruling.
iShares Gold CHF Hedged (CH) (CSGLDC.SW): Gold. I applied some of the profits to a hedging gold trade. This ETF hedges the Swiss Franc vs US Dollar exposure which will make it a dual safe haven hedge.
Sold
In one of my portfolios, I needed to raise funds to make payments to portfolio beneficiaries. I used the opportunity to take profits and to reduce exposure to Europe indices. I do not like selling in selloff periods but I had no choice in this case. It is a lesson in taking profits on a more consistent basis over time
A key part of these positions is relative exchange rate moves - beneficiaries will be paid in Pounds or Australian Dollars
ComStage Dow Jones Russia GDR ETF (CBRUS.SW): Russia Index. Closed this holding in Russia for 17% profit since August 2017. This transaction is exchange rate neutral in GBP and plus 6% in AUD over the holding period.
iShares EURO STOXX Mid ETF EUR Dist (DJMC.SW): Europe Mid Caps. 32% profit since July 2011 and another 6% in GBP and 17% in AUD.
iShares Euro Dividend ETF EUR Dist (IDVY.L): Europe Dividend Index. 20% blended profit since April 2011 and December 2012 if I split the profit calculation between the highest and lowest entry prices. 2% profit only if applied entirely to April 2011 entry. Listing is in GBP. Add in 14% appreciation of GBP vs AUD in this time
iShares MSCI Europe ETF EUR Dist (IMEU.L): Europe Index. 22% profit since April 2011. Listing is in GBP. Add in 14% appreciation of GBP vs AUD in this time
Shorts
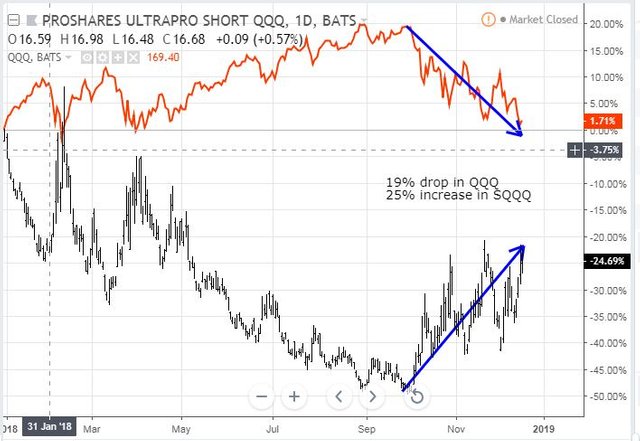
Implied volatility has risen dramatically in the selloff which affects the viability of using put options as hedging tools - one has to look at put spreads. In one of my portfolios, I am not permitted to set up spreads without holding the stock. Of course I do not want to buy a position in the underlying stock to allow me to construct a spread - that defeats the object. There are a range of ETF's that allow you to go short the index you want to track. I am keen to hedge exposures in one of my portfolios so I constructed a trade using an inverse ETF on the Nasdaq index (Proshares Ultra Short QQQ - SQQQ) . The ETF I chose is also leveraged 3 times - so for a small outplay I can hedge 3 times my exposure. Using options, I can increase that too. There is a cost of shorting which has to be factored in. The comparative chart shows SQQQ (black bars) has gone up 25% points in the time QQQ has gone down 19% points - i.e., not leveraged 3 times.
ProShares UltraPro Short QQQ (SQQQ): Short US technology. I bought a small holding in the ETF (0.1% hedged) and a March 2019 16/22 bull call spread for net premium of $1.31 offering maximum profit potential of 358%. The call option increases my hedging exposure. My plan will be increase the exposure on days that Nasdaq goes up. Let's look at a chart which the bought call (16), breakeven and 200% profit as blue rays and the sold call (22) as a red ray with the expiry date the dotted green line on the right margin
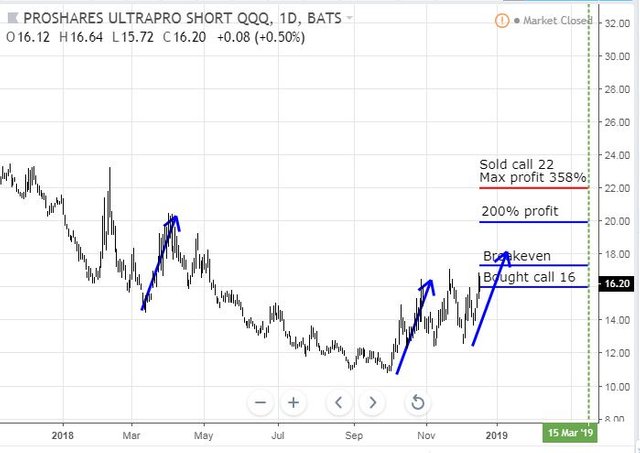
The maximum profit line is at the same level as the February 2018 selloff. The price scenarios (blue arrows) show that breakeven is easily in target in the current cycle and the 200% profit level matches the highs reached in April 2018. This feels like a tidy hedging trade.
SPDR S&P 500 ETF (SPY): US S&P 500 Index. Closed January 2019 276/262 bear put spread for 211% profit since October 2018 (just under 2 months). Replaced with February 2019 254/244 bear put spread for net premium of $3.52 offering maximum profit potential of 184%
Let's look at a chart which shows the bought put (254) and breakeven as red rays and the sold put (244) as a blue ray with the expiry date the dotted green line on the right margin. I have left in the contracts just closed with dotted rays.

The pink arrow price scenarios show that this trade can reach breakeven. Price will have to drop to August 2017 lows for the trade to reach maximum potential. This feels a bit of a stretch. I will look to place another hedging trade if price makes a drive up to the $270 level - then a big pink arrow leg down might not look that uncomfortable
Cryptocurency
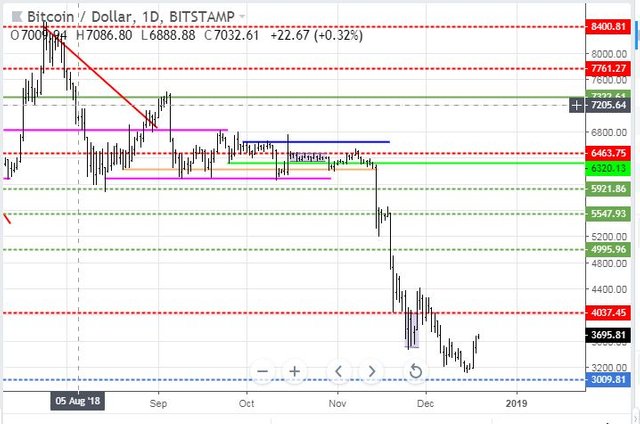
Bitcoin (BTCUSD): Price range for the day was $262 (7.6% of the low). Price has now cleared the short term resistance level of $3600 and has made a higher high and made new highs on 5 successive days
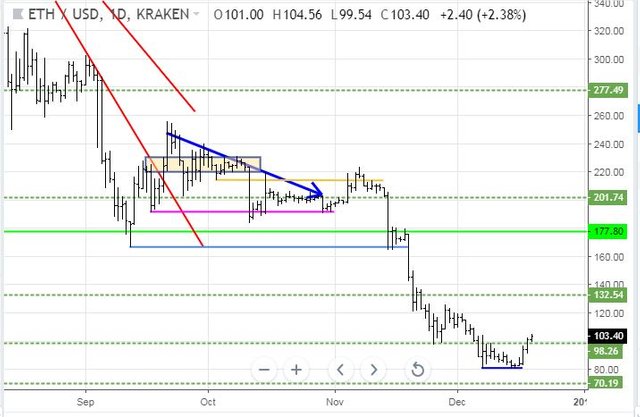
Ethereum (ETHUSD): Price range for the day was $11 (12% of the low). Price has broken back above the $100 resistance level and is just a little short of making a higher high.
CryptoBots
Outsourced Bot No closed trades. (222 closed trades). Problem children remains at 19 coins. (>10% down) - DASH (-73%), ETH (-73%), ZEC (-70%), AE (-40%), LTC (-50%), BTS (-66%), ICX (-87%), ADA (-76%), PPT (-86%), DGD (-87%), GAS (-89%), SNT (-68%), STRAT (-70%), NEO (-86%), ETC (-68%), QTUM (-77%), BTG (-72%), XMR (-53%), OMG (-77%).
Coins moved in a tight band of 1 or 2 points, mostly up. STRAT improved 6. GAS (-89%) remains the worst coin.
Profit Trailer Bot No closed trades.
Dollar Cost Average (DCA) list remains at 4 coins with all coins trading worse. This is quite normal on days BTC and ETH climb - the alt coins lag.
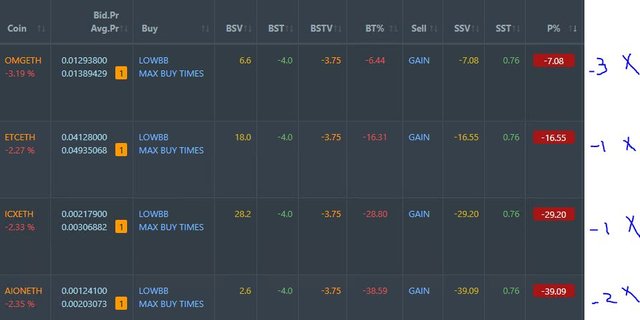
Pending list remains at 8 coins with all calls a little worse
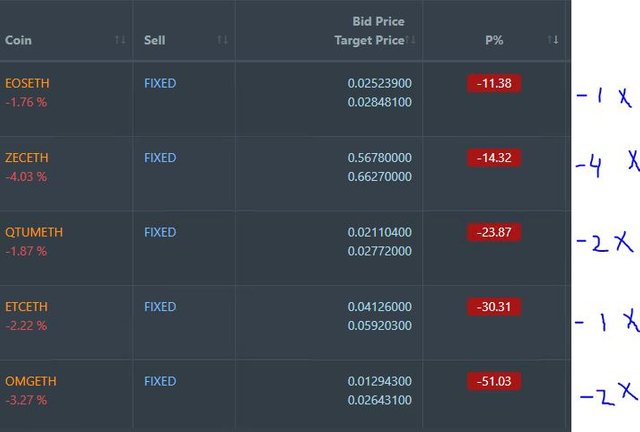
PT Defender continues defending 7 coins - no changes.
New Trading Bot Trading out using Crypto Prophecy. No closed trades.
Currency Trades
Forex Robot did not close any trades and is trading at a negative equity level of 3.1% (lower higher than prior day's 2.4%).
Outsourced MAM account Actions to Wealth closed out 2 trades for 0.05% losses for the day. Open trades are 0.4% negative. There are not normally trades left open overnight.
Cautions: This is not financial advice. You need to consider your own financial position and take your own advice before you follow any of my ideas
Images: I own the rights to use and edit the Buy Sell image. News headlines come from Google Search. All other images are created using my various trading and charting platforms. They are all my own work
Tickers: I monitor my portfolios using Yahoo Finance. The ticker symbols used are Yahoo Finance tickers
Charts: http://mymark.mx/TradingView - this is a free charting package. I have a Pro subscription to get access to real time forex prices
December 18, 2018
Little spread trading strategy with CSCO and RYT, I like it. That divergence will converge at some point.
Need get some pot stock exposure myself, been talking about it for too long need to just do it.
Thanks
I am learning with pot stocks to nibble away at a few as the field is very volatile and cash demands are steep. I am also sticking to those with exposure to legislated markets. I am especially staying away from those aiming for US until such time as the Federal Government legalizes. I am wary of the evangelists introducing legislation. there are enough stocks listed in US that could fir the bill. TLRY and APHA in my portfolios are both listed in US.
Timing: wait for a down day and make a nibble. We will get one soon when everyone forgets the Tilray news.
I have been wondering what lies after the Fed decision as only a couple of more days remain before year end and I don’t think we yet know the implications of portfolio rebalancing but I am sure that it will bring added volatility...
Posted using Partiko iOS
My gut tells me rebalancing will be quiet this year because a lot of that got shaken out in the selloff. As for Fed words - no matter what they say or do the fear mongerers and "told you so" crew will be onto them
Loving your analysis.
Thanks