TIB: Today I Bought (and Sold) - An Investors Journal #319 - Europe, Media Technology, Software, Altcoins
Interest rate markets told me the oil markets were wrong in early trade. Markets wanted to go down and they did all day. German software giant, SAP, surprised markets with a big acquisition. I decided it was a discount offer to good to miss for the long term. Profits banked after the Arris takeover I wrote about last week and in Europe - mostly to do with the Australian Dollar weakness.

Portfolio News
Market Jitters Traders came to work today and traded the markets down.
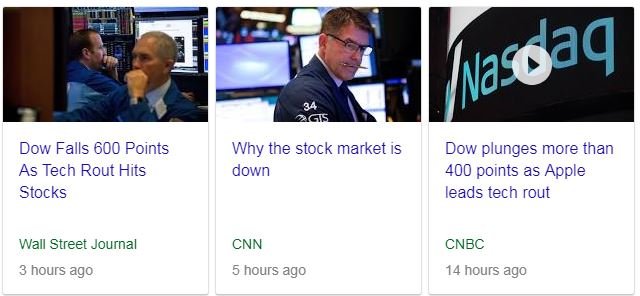
The catalayst appeared to be Apple (AAPL) and Tech stocks. This accelerated when oil gave up the early gains and kept running into the close. On Veterans Day the bond markets are closed - this takes away half the market signals and a lot of trading volume. I hate those low volume days when the sellers come to work - it just makes it a whole lot worse.
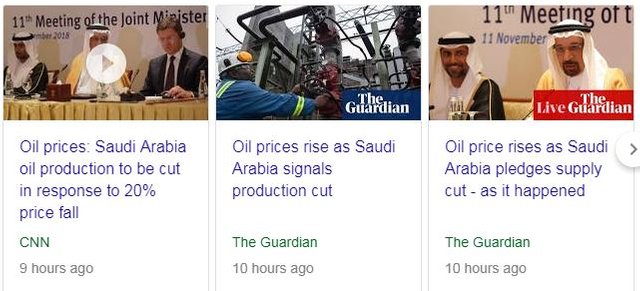
The oil price was the surprising move. Saudi Arabia indicated after the OPEC meeting that they thought there was an emerging glut situation and they would reduce output. That did push oil prices up with a move in Brent crude about 2% when European markets opened. I was surprised to see it reverse to close to 2% down when US markets closed.
Interest rates were already indicating a tough day for stocks - here is the Euribor chart . Japan and US looked the same.
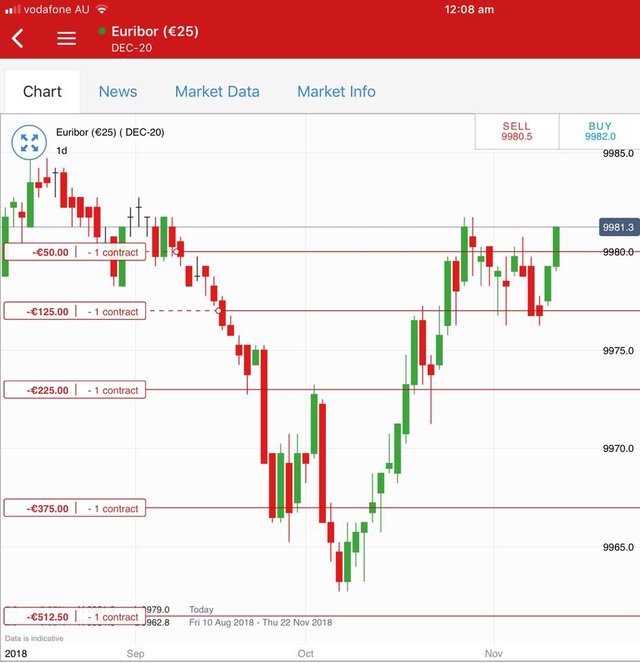
It is always hard to put the finger on what is driving sentiment. The talking heads were leaning to softer global growth. They always panic about the Federal Reserve. The big problem is the Federal Reserve looks backward at data - that is pointing to solid growth and rising inflation = hike time = will they overdo it again?. Tweets from Donald Trump about oil prices did not help.
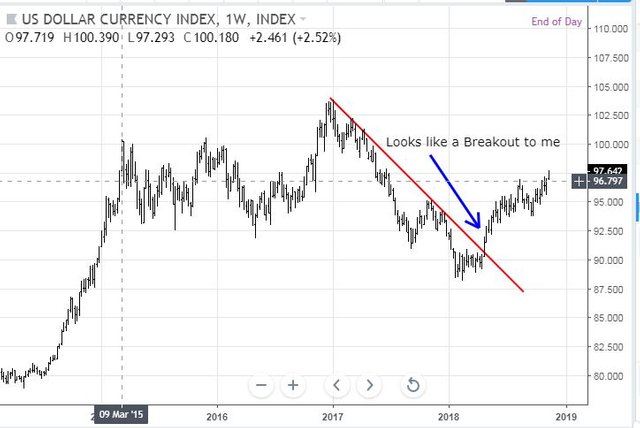
The real market story is the US Dollar making a 12 month high (nearly 18 month from May 2017) - here is an updated chart. This is now providing a level of hedging for a lot of my portfolios especially given I spend in Australian Dollars.
Bought
SAP SE (SAP.DE): Enterprise Software. SAP announced that they would buy survey company Qualtrics in an all cash deal ahead of its upcoming IPO.
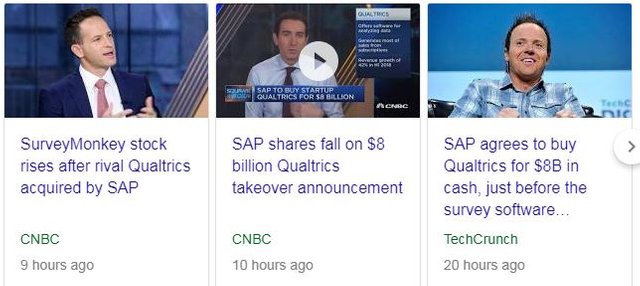
Qualtrics operates in the whole arena of customer experience management of which customer surveys are a part. I watched an interview with Bill McDermott, CEO of SAP and Ryan Smith, CEO of Qualtrics. What struck me is the two men have forged a strong relationship and story which they both believe in about adding a customer experience dimension to SAP's operations focus. My purchase decision was based on a belief that this capability would give SAP a different angle to compete against the likes of salesforce.com (CRM) in customer management and Oracle (ORCL) in enterprise software.
https://www.cnbc.com/video/2018/11/12/sap-to-buy-startup-qualtrics-for-8-billion.html
The headline on this video made me chuckle. Qualtrics is hardly a startup as it has been in business for 16 years and just sold for $8 billion. Now to the charts which compares SAP (SAP - US Listing - black bars) to salesforce.com (CRM - red line) and Oracle (ORCL - orange line).
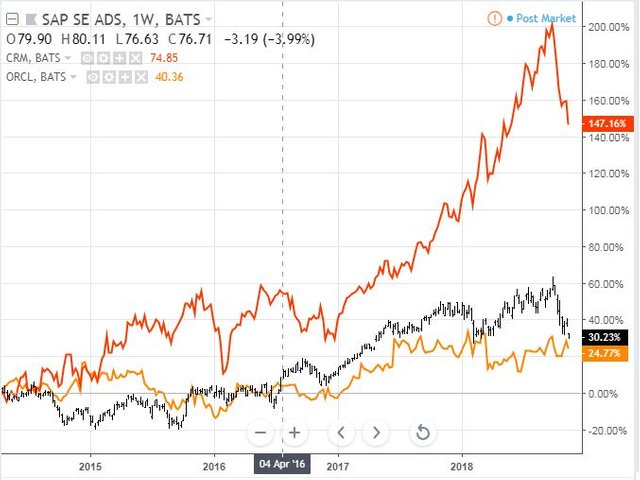
My trade idea is for SAP to close some of the gap to CRM - one half would be spectacular (+46%) but a third would be mighty handy (+31%). It seems the New York Times agrees with my view.
https://www.nytimes.com/2018/11/12/business/dealbook/sal-qualtrics-acquisition.html
Sold
Arris Group Inc (ARRS): US Media Technology. CommScope (COMM) announced the acquisition of Arris on November 8 to create a global communications technology provider. The deal is for $31.75 in cash and is expected to close in mid 2019. I have learned over time to hit the exits when acquisitions come along as a lot can go wrong between announcement and completion. My sale price was $1 less than the acquisition price. Trade made for 4.1% profit since August 2014. The initial trade idea from Changewave Research was to benefit from the cord cutting phenomenon as Arris is a leading supplier of set top boxes used for streaming services.
https://www.commscope.com/NewsCenter/PressReleases/CommScope-to-Acquire-ARRIS/
It always pays to look back and learn about a trade idea. The first chart compares Arris (black bars) to CommScope (red line) and it shows my initial entry point and level (the dotted blue line).
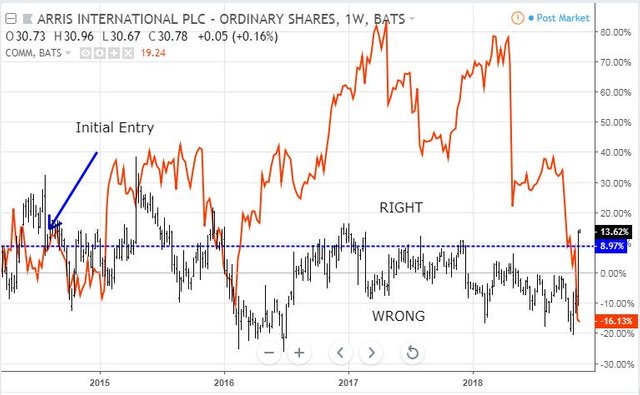
Early days for the trade were solid with a 20 percentage points gain and then the sideways and down drift began. For the majority of holding time the trade was wrong. The bid from CommScope pulled the trade back into positive territory literally in the last week. If one had been holding CommScope all that time one would have felt a lot better for a lot of the journey (up 80 percentage points) but ending up in about the same place after the bid. This chart does not convince me to consider buying CommScope
I am going to put up one more chart to show if the cord cutting theme was the right theme. I have added in 3 stocks - Dish TV (DISH - red line); Comcast (CMCSA - yellow line) and Liberty Sirius (LSXMA - orange line) all of whom are involved in TV broadcasting in some form.
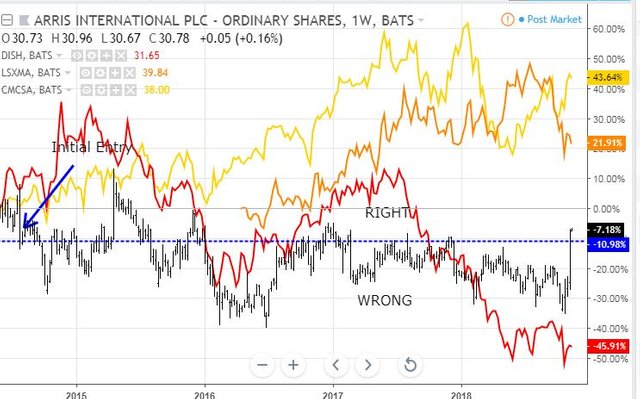
What do we learn? Cord cutting has hurt a business like DISH. For the rest it looks like the technology provision has behaved like a competitive commodity business and content has been an important driver to win the cord cutting battle.
IShares Europe ETF (IEU.AX): Europe Index. I needed to raise some Australian Dollars to meet the month's bills. I have been progressively reducing exposure to Europe at the index level in favour of specific stocks and also shifting emphasis back to growth possibilities in US and Emerging Markets and China. Add in a little bit of out of patience with Europe Muddles. I booked 18% profit since November 2016. In that time period the Eurostoxx 50 went up 5.5% in Euro terms - the other 13% of my return is the decline in the relative value of the Australian Dollar.
Cryptocurency
Bitcoin (BTCUSD): Price range for the weekend was $149 (2.3% of the high). Price proved that it was not happy with the heights of $6500 and tested down to the short term resistance line a few times (fluoro green line)
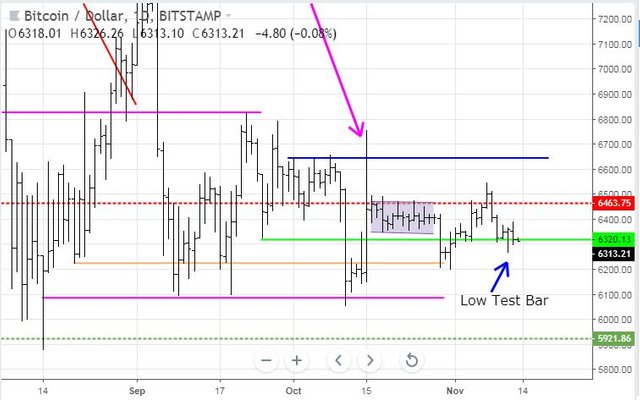
The good news is the test bar is a low test bar and it forms a higher low for the next push forwards to have another go at going past $6500.
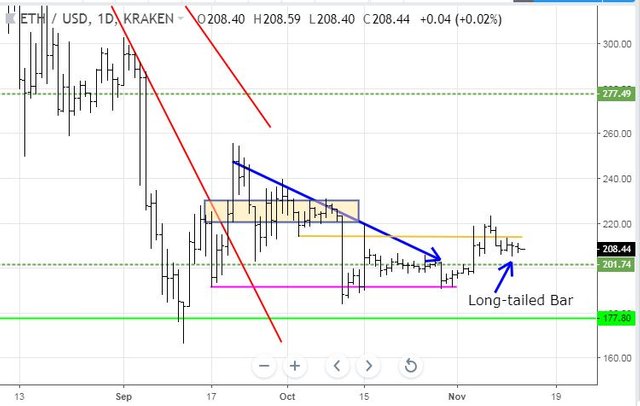
Ethereum (ETHUSD): Price range for the weekend was $8 (3.8% of the high). This chart feels different to Bitcoin with price respecting the short term resistance line (ochre line) and drifting in "no mans land" towards the $200 level but staying above it. There is a long-tailed bar in here too but it is not testing a level = just another bar. And we have not yet seen confirmation that that low was a higher low
CryptoBots
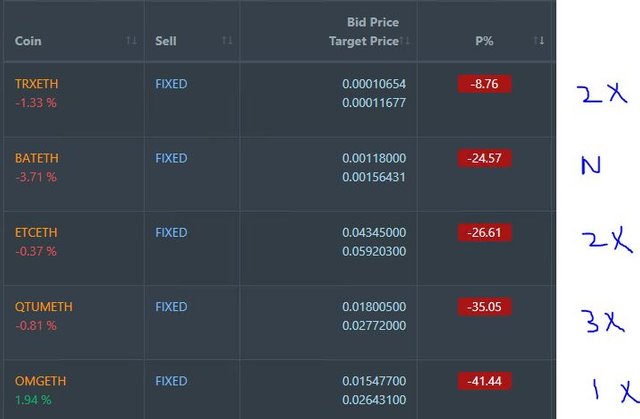
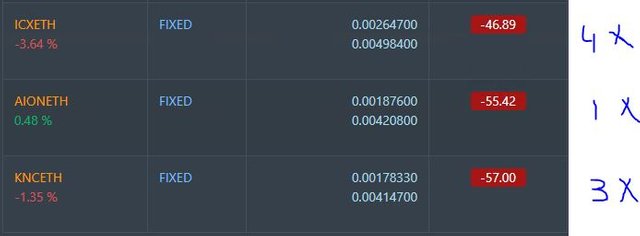
Outsourced Bot No closed trades. (221 closed trades). Problem children stayed at 18 coins. (>10% down) - ETH (-68%), ZEC (-60%), DASH (-66%), LTC (-53%), BTS (-54%), ICX (-81%), ADA (-70%), PPT (-80%), DGD (-82%), GAS (-84%), SNT (-59%), STRAT (-75%), NEO (-82%), ETC (-60%), QTUM (-76%), BTG (-72%), XMR (-39%), OMG (-68%).
Coins went down 1 to 3 points with only QTUM improving. ICX (-81%) and ETC (-60%) dropped a level and GAS (-84%) remains the worst coin.
I did add a little more juice and robot opened new trades on ENG.
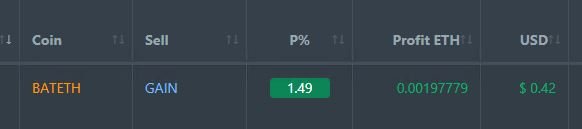
Profit Trailer Bot One closed trade (1.49% profit) bringing the position on the account to 4.27% profit (was 4.24%) (not accounting for open trades).
I have taken BCC off the whitelist ahead of the hardfork on November 18
There remain 5 coins on the Dollar Cost Average (DCA) list.
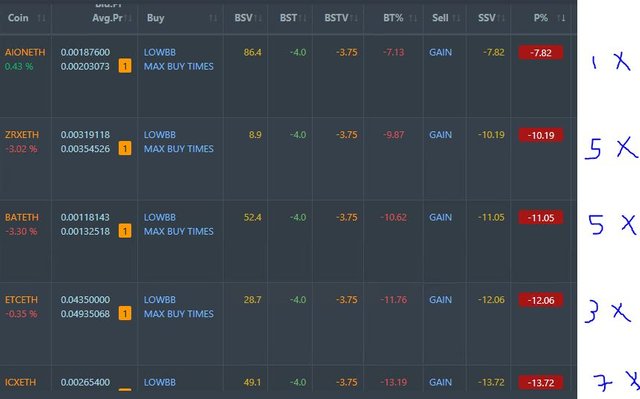
All the coins did quite a bit worse than the last report - this is beginning to feel like the trading period when the long list of problem trades came about earlier this year. This is becoming a frustrating process as I have mapped out a strategy that I think works but I cannot implement it until the pending list and the DCA list is cleared. Of course, I can front up and take the losses and sweep the deck clean.
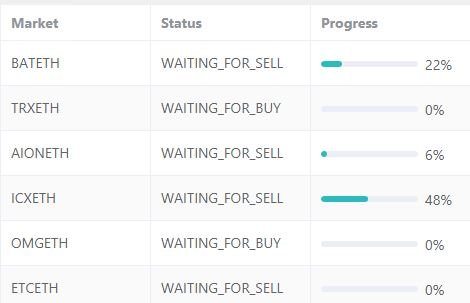
Pending list moves to 8 coins with BAT added to PT Defender defence. All coins traded worse - this is quite normal when Ethereum is showing some strength.
PT Defender is now defending 6 coins with BAT added to the list after the pump and dump last week. It has completed one BAT trade.
New Trading Bot Trading out using Crypto Prophecy. PIVX trade closed for 0.47% proft. I moved the exit target to bring it in line with the top Bollinger Band - trade open for 6 days. One new trade on SC. Trade size was a bit bigger than normal and I set two take profit targets.
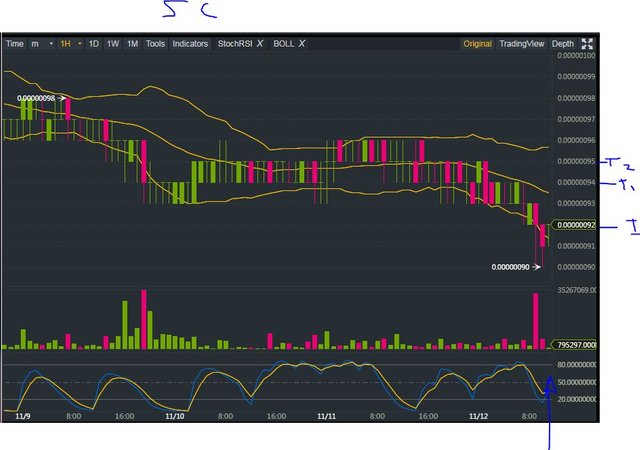
Entry looks text book BUT it is hard to believe that price will move a whole price point when the price levels are small numbers - hence split targets one below the centre line and one below the top band.
Currency Trades
Forex Robot closed 4 trades (0.13% profit) and is trading at a negative equity level of 1.2% (higher than prior 0.8%).
Cautions: This is not financial advice. You need to consider your own financial position and take your own advice before you follow any of my ideas
Images: I own the rights to use and edit the Buy Sell image. News headlines come from Google Search. All other images are created using my various trading and charting platforms. They are all my own work
SAP logo is licensed under the Creative Commons Attribution-Share Alike 4.0 International license
https://commons.wikimedia.org/wiki/User:VitVit
Tickers: I monitor my portfolios using Yahoo Finance. The ticker symbols used are Yahoo Finance tickers
Charts: http://mymark.mx/TradingView - this is a free charting package. I have a Pro subscription to get access to real time forex prices
Crypto Prophecy provides a useful tool to identify oversold and overbought coins - https://mymark.mx/CryptoProphecy
November 11-12, 2018
The market seemed that it wanted to break some technical support levels today as volumes were low. While it doesn't seem that they were too successful given the gap that exists with the previous low from late October, Volatility exploded higher. Lots of moving pieces still at play!
It would help if Donald Trump stayed away from Twitter and let the market set its own prices. I thought his tweet about oil supply really showed some naivete about markets. Truth is the markets were setting the price higher