TIB: Today I Bought (and Sold) - An Investors Journal #292 - Dutch Postal Services, Corn, Altcoins (GTO, LSK), 56 Percent Club Update.
Trade becomes centre stage again and drags markets with it. India surprises with world leading GDP numbers. Trade activity is quiet ahead of US Labor Day. New leaders in the 56 Percent Club with a new entrant rocketing to the top of the Options chart. Who would believe that 3D printing was such a topic? I did.

Portfolio News
Market Jitters - Temper Tantrum August was a strong month for US stocks despite the holiday volumes.

Not so for the rest of the world's markets with the trade turmoil and the strong US Dollar hammering Emerging Market currencies and flowing onto their stocks. The Canada-US trade talks did not produce a result after 3 days work on Friday. They will go back to work after the Labor Day holiday on Tuesday. Meanwhile, Donald Trump, as only he knows how, went back on the offensive against Canada. That has rattled markets on Monday and as there is no trading in US because of the holiday, the markets will stay rattled until Wednesday when they can digest first day back after the summer lull on Tuesday.
https://www.cnbc.com/2018/08/31/us-markets-global-trade-tensions-ramp-up.html
Adding to the pressure is the end of the consultation period on the $200 billion of US tariffs on September 6.

The talking heads are fully expecting a raft of announcements to flow directly after that. The big agenda, they say, is not really tariffs but the way China forces its partners to do business whether it is in technology sharing demands or intellectual property theft or loans for investment, etc, etc.
US interest rates started to edge back towards 3% (on the 10 year).
https://markets.ft.com/data/bonds/government-bonds-spreads
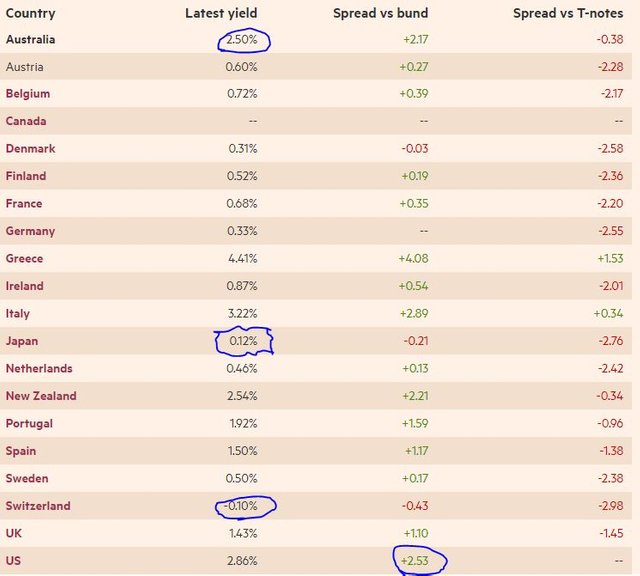
Time to step back a little and look at the numbers. Interest rates are supposed to reflect underlying inflation and risk, both credit risk and market risk. The table lists yields on 10 year government bonds for 20 countries (data is from UK - so it is Europe plus some others) and the spreads between the country rate and the German rate (bunds) and US Treasury.
What stands out for me.
- Australian yield is lower than the US yet there is significant market risk in the currency and exposure to commodity prices and a strong US Dollar.
- The spread between US rates and Germany is as high as Australia's total yield
- Of the countries listed Japan has a debt deficit that is the worst, nearly twice as bad as Italy, yet its yields are 2nd lowest on the list
- Donald Trump keeps accusing Europe and China of manipulating their currencies. Switzerland has been able to keep its interest rates negative in a tight band for 3 whole years - that feels like manipulation to me.
- Portugal is 5th in debt deficit and is 25% worse than US yet its yields are lower than US. Its debt is three times that of Australia yet its yield is lower.
- France and Spain have similar debt structures yet yields in France are half those of Spain. Yes unemployment is higher in Spain (15%) but the 9% in France is not great.
As I read this chart, I am going to suggest that there are very few free markets in the list - Australia, New Zealand, United Kingdom perhaps and United States (once the Federal Reserve finishes normalizing its balance sheet)
Country data from https://tradingeconomics.com/
India Latest GDP growth data propels India up the growth charts at 8.2%.
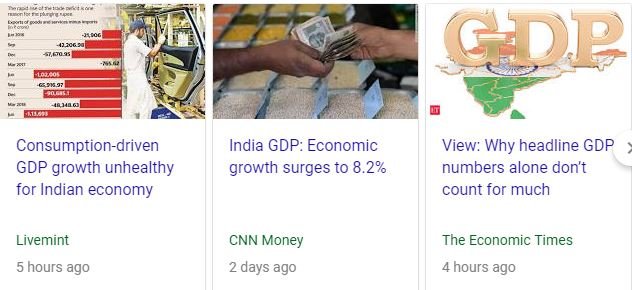
Only Ireland is ahead. Debt to GDP rate is about the same as Ireland. Whether this will this propel my portfolio holdings in India is unclear - India is classified as an Emerging Market just like the rest. The encouraging parts of the report were a surge in exports on the back of a lower Indian Rupee and a step up in consumption spending. There is a statistical wrinkle in the data as the comparable base includes the impact of the indirect tax changes and demonetisation event. India is also the world's second largest oil importer - a rise in Brent Crude prices will push up imports.
Bought
Post NL (PNL.AS): Dutch Postal Services. Post NL operates a dividend purchase program where one can buy stock with dividend proceeds. What I like is the program operates without withholding tax which applies for dividends paid in cash. I took advantage and took the dividend in stock. I do get credit for tax withholding under the tax treaty that operates but that takes time to work through to my numbers. This way is instant Of course, if the stock price rises before I sell, I do have to pay capital gains tax on the profits.
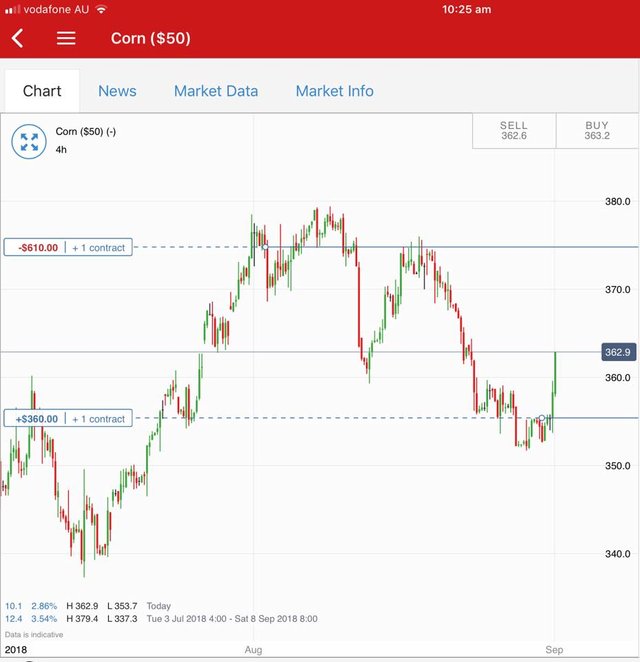
Corn Futures: Last week I reported the rolling over of the September futures on corn that I was holding. I am also invested in Corn CFD's in my IG Markets account. Price seems to have collapsed in the flow into the September futures expiry and then bounced. I added another CFD position on the bounce - you can see it was a few days back
56 Percent Club
Another month passes and it is time to report on the stocks and options that have done better than 56 percent up. Each month, I review all my portfolios and tabulate the 56 percent movers from all time and highlighting the ones from the last 12 months. I review stocks and options separately. Why 56%? A friend was spruiking an investment scheme on Facebook and asked if anybody could point to a 56% investment - yup - I have a few.
First is the table of stocks. I have highlighted ones that are new to the club in Yellow. I have also marked up whether they have gone up or down since last time.
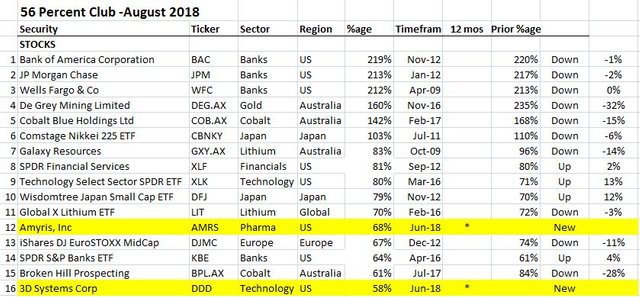
What stands out?
- The list has fewer stocks than last time (16 vs 17). There were no sales in August.
- US Banks take over the top of the list with Bank of America (BAC) the top. This was a case of De Grey Mining (DEG.AX) falling as all 3 banks actually dropped in the month
- There were two new entrants, one in pharma (Amyris - AMRS) and one in 3D printing (3D Systems - DDD). What is cool is both were only added to the portfolios in June 2018.
- This was a weaker stocks month with 4 risers, 13 fallers and 2 new entrants. Biggest mover up was a close run thing between Japanese Small Caps (DFJ) and US Technology ETF (XLK)
- Dropping off the list are Dutch/US insurer (Aegon - AGN.AS), Russia ETF (RSX) and a Europe ETF (IMEU.L).
- Resource stocks continue to slide with cobalt, lithium and gold all sliding. I can only attribute this to a rising US Dollar
- Two of the stocks were bought in the last 12 months, both in June 2018.
There is one notable miss to mention. Castillo Copper (CCZ.AX), an Australian copper miner and cobalt explorer did rise 72% in one of my portfolios but not enough to drag the average above 56%. This was the resource exception and it shows how resource investing works. Early investors and speculators follow a stock. When the reserve estimates start to come out the price rockets and more speculators enter. As soon as the reality of what the mine will cost becomes known the speculators desert the ship and leave it to the investors to harvest the steady income.
On the options side
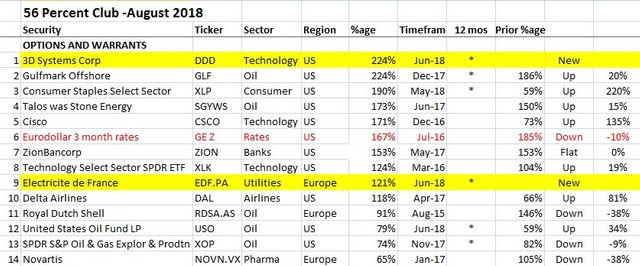
What stands out for me:
- The list has the same number of stocks as last time (14 vs 14) with one sale and two roll ups (i.,e., list would have been 17).
- There is a new leader in 3D printer, 3D Systems (DDD) replacing US regional bank, Suntrust (STI). Suntrust was sold. 3D was also a new entrant to the list bought 2 months ago in June 2018
- Other new entrant to the list is a return for French utility, Electricite de France (EDF.PA).
- Dropped off the list are oil drilling stock, Transocean (RIG). US regional bank, Keycorp (KEY) and AholdDelhaize (AD.AS), Dutch/US superrmarket group dropped off the list after a profit taking rollup to a higher strike or later expiry.
- Oil stocks still hold their sway with 5 out of 14 holdings in oil.
- Fastest riser is 3D Systems coming from nowhere to 224%.
- The notable riser really is Consumer Staples ETF (XLP) - this was bought as a defensive hedging type investment. What it demonstrates is how US markets have switched their investing power to US household names like Kimberly Clark and Procter & Gamble
- 6 out of 14 positions were bought in the last 12 months.
- 7 risers, 7 fallers/flat and 2 new.
My investing portfolio is running some big themes most of which are represented here
- Interest rates to rise (includes banks and insurance companies)
- Japan and Europe relatively undervalued compared to US
- Electric vehicles and battery demand (lithium and cobalt)
- Rising oil prices (oil producers, oil explorers and oil services - drilling doing better than others, Russia)
- Technology driving productivity
What is not doing that well or just not made it to 56%
- Emerging Markets growth rates
- Shipping (though I am now invested mostly in oil shipping having sold most bulk shipping holdings )
- Shale oil
- Other growth minerals (zinc, nickel)
- Marijuana
- European and Japanese interest rates
- Recovery stories (Italy, Greece, Turkey, Uranium, Coal)
- eSports/Gaming
Note: crypto investments are not covered. My BTC and ETH holdings are off the scale because I started early.
Cryptocurency
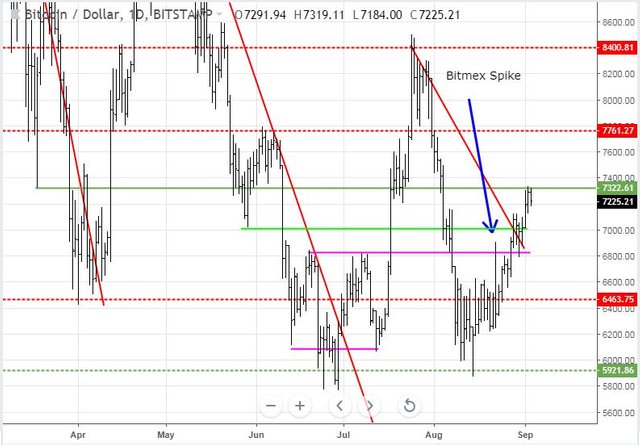
Bitcoin (BTCUSD): Price range for the weekend was $455 (6.6% of the low). 3 solid days of price action making new highs and driving price to a key resistance level. What makes this a key level is that it comes from one of the really hard drops in price in March 2018 and it was the end of a week (the olive green line from a weekly chart). It seems that seller exhaustion has set in. If price can pass that level ($7300) there is a chance to move with momentum to the next level of $7750
Ethereum (ETHUSD): Price range for the weekend was $26 (9.4% of the low). Price started doing what Bitcoin price did and made a new high on Saturday but then ran out of steam and sagged back towards the support level.
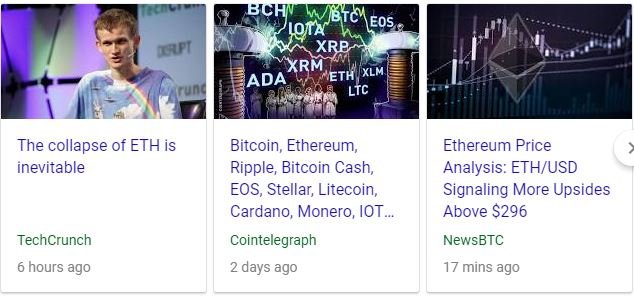
The news flow about Ethereum is giving mixed messages. The launch of Ether futures by the CBOE is heralding a fear that it will increase volatility though it also raises awareness and access to a wider audience. A stomping ground for bears is the way it is described here.
https://bitcoinist.com/eth-futures-ethereum-bitcoin-tom-lee/
There is also talk of reducing the Ether mining reward from 3 ETH to 2 ETH - this changes the economics of ETH mining. And then there are doubts about the whole software and development model - too centralized; not sufficiently scalable; will be gamed to pay ETH Gas for transactions. It all feels like an investing minefield.
https://techcrunch.com/2018/09/02/the-collapse-of-eth-is-inevitable/
CryptoBots
Outsourced Bot Two closed trades (ZEC, GAS) for average profit of 1.71%. One new trade opened on PPT (-7.7%). (220 closed trades). Problem children stayed at 18 coins. (>10% down) - ETH (-61%), ZEC (-60%), DASH (-61%), LTC (-47%), BTS (-48%), ICX (-73%), ADA (-64%), PPT (-77%), DGD (-78%), GAS (-79%), SNT (-57%), STRAT (-72%), NEO (-78%), ETC (-46%), QTUM (-75%), BTG (-74%), XMR (-39%), OMG (-63%).
Quite a few coins improved more than 2 points with DASH and XMR the biggest improvers. ZEC (-60%) dropped down a grade and GAS (-79% - still the worst) and XMR (-39%) went up a grade. BTG data last report was wrong and now correctly reported at -74%. BTG has had a whipsaw ride over the weekend.
A few observations: This bot is set up as multiple sub-bots with a choice of at least 15 coins per bot. It does allow multiple trades on a coin in each sub-bot. The winning trade on GAS this report was a new trade on a sub-bot already holding GAS. So too is the new trade on PPT. It does provide for stop losses. I did not set those up at the start which was a bad choice.
Profit Trailer Bot Three closed trades (1.30% profit) bringing the position on the account to 1.79% profit (was 1.75%) (not accounting for open trades).
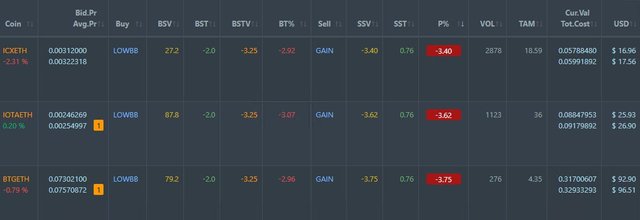
Dollar Cost Average (DCA) list has swelled to 3 with ICX and BTG joining IOTA. The DCA changes to buy on Low Bollinger Bands are in fact working with BTG and IOTA adding trades. The worrying part of this list is all 3 coins are coins that have been added to PT Defender. They will not be on a whitelist once they are trade out. Also worrying is the size of the BTG position (far right hand column) which has now done 4 levels of DCA in two incarnations. I did switch off DCA buys after these two additional buys.
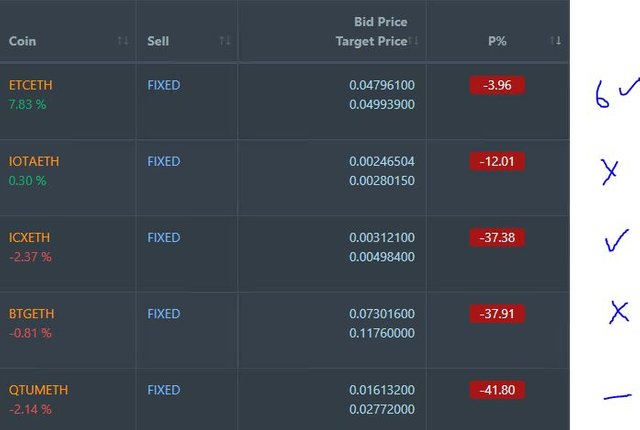
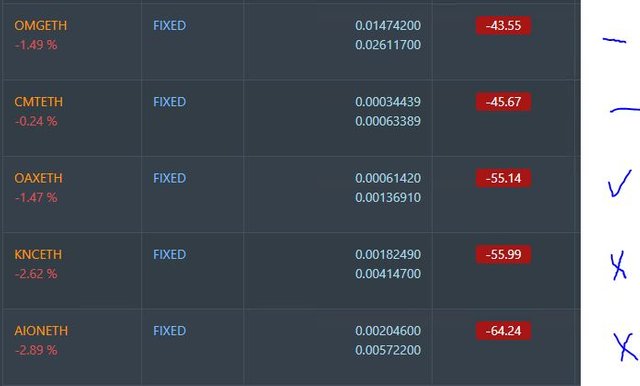
Pending list remains at 10 coins with 3 coins improving, 3 coins trading flat and 4 worse.
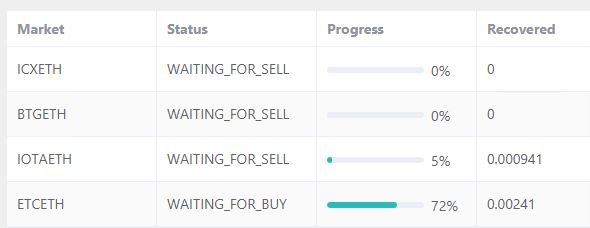
PT Defender is now working on 4 coins with BTG added. It is waiting for buys on 3 coins and for a buy on ETC.
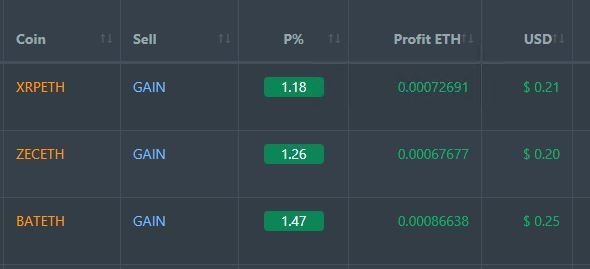
New Trading Bot Trading out using Crypto Prophecy. Closed out one open trade from last list (GTO - 3.2% to average 2.2%). Closed half trades on XLM, LSK and POA for 1.3% profit each. New LSK and POA trades were based on Crypto Prophecy screens. Trades remain open on LINK, RCN (one quarter), LSK and POA. Two charts to tell the story starting with a closed trade on GTO.
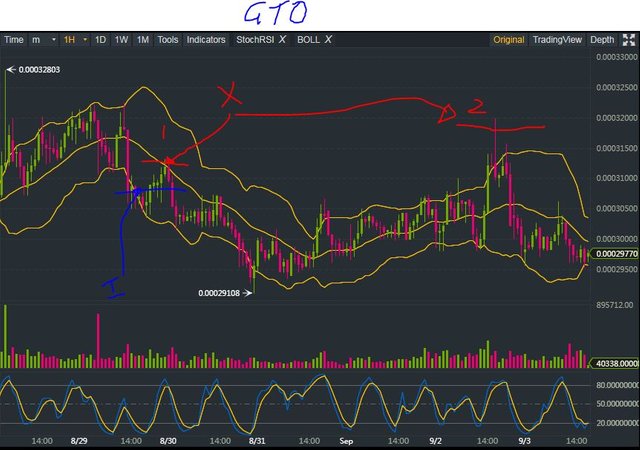
GTO trade was selected at a time when trend was an uptrend with entry off the low Bollinger Band (marked I). First target was hit at 1.3% eight hours later as price reached the centre of the bands. Price promptly turned over and headed back to the bottom of the bands with the 2nd exit just short of 4 days later. I had chosen the level below the high of the big drop before the entry point. The high of the 2nd exit bar was about the same level and then price fell over again. Distance from entry point to the low shown on the chart is 5.4%. The theory of this trade was to pick a rising trend and see how much of a run I could win. The truth is it was an uncomfortable journey as the chart turned down and then up again.
The next chart shows a trade on LSK which is part way through its journey.
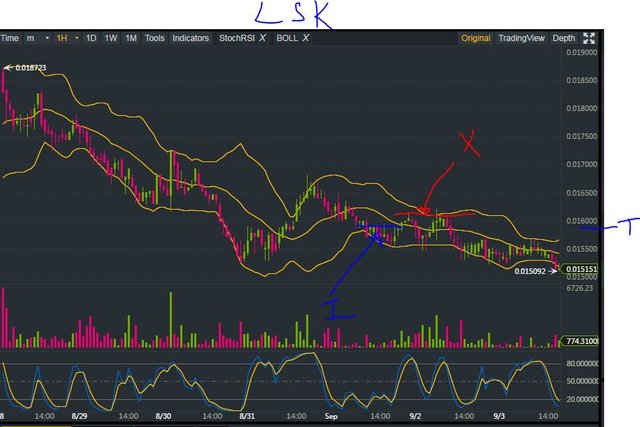
Again the entry point was when the trend had been upward though as part of basic downward looking chart. Price tracked for quite a few bars along the lower band before making its way to the centre band but taking two turns to make it to the 1.3% exit at the top band. I have put in an exit target (marked T) above breakeven but not as far as the 1st exit. The low shown is also just over 5% below the entry point.
What I am taking out of this approach - the signals appear to work for entry. A trailing entry approach would be better. The stochastic cross overs (lower window) work better for specific entries. 1.3% stretch for 1st target is working typically within 4 to 7 hours. A stop loss wider than 5% would work to protect trades but have a low risk of being hit. It is taking too long to hit a stretch target especially with underlying volatility of BTC and ETH.
Currency Trades
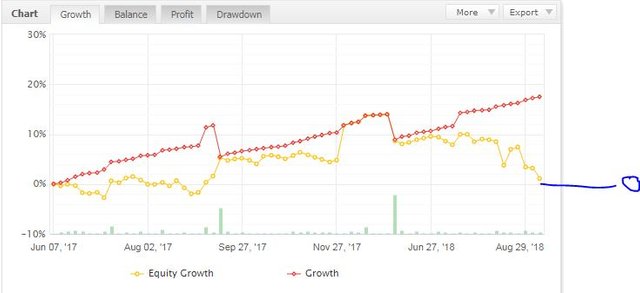
Forex Robot closed 6 trades (0.23% profit) and is trading at a negative equity level of 17.9% (way higher than prior day's 14.9%). This negative equity level is concerning. If the account was to be closed now, all the gains made in the last 12 months will be wiped out. The equity growth chart shows the orange line tracking back to zero.
Outsourced MAM account Actions to Wealth closed out 2 trades for 0.15% loss for the day. This brings a horror month to a close losing 4.2% of the balance - no performance fees for that effort.
Cautions: This is not financial advice. You need to consider your own financial position and take your own advice before you follow any of my ideas
Images: I own the rights to use and edit the Buy Sell image. News headlines come from Google Search. Yield image comes from Ft.com. All other images are created using my various trading and charting platforms. They are all my own work
Tickers: I monitor my portfolios using Yahoo Finance. The ticker symbols used are Yahoo Finance tickers
Charts: http://mymark.mx/TradingView - this is a free charting package. I have a Pro subscription to get access to real time forex prices
Crypto Trading: get 6 months free trades with Bitmex for leveraged crypto trading. http://mymark.mx/Bitmex
Crypto Prophecy provides a useful tool to identify oversold and overbought coins - https://mymark.mx/CryptoProphecy
August 31, 2018
Will be interesting to see if there will be any followthrough with the markets getting more volume after the long weekend. September and October have always been more explosive months in the past with a bias to the downside but the momentum seen from the Summer has been impressive.
There will be a move and I am sure too it will be big. Which way will be driven by how fearful people are about the trade situation. Trump posturing over the weekend will not help.
The big surprise inteh 56% club was the run up in XLP options. This tells me that we might see a big divergence in market reaction. Continue to support quality US stocks (those in XLP and XLK) and small caps and smash everything else, especially foreign else.
We will know within 30 minutes of market open tonight.
iam very inspired with you sir and i support your works,i beg your support sir @carrinm
good and useful posts