Steemit Crypto Academy Season 4 | Intermediate course–week 5 Homework Post for @allbert | Trading with Accumulation / Distribution (A/D) Indicator
Hello everyone, welcome to season 4 week 4 of the steemit crypto academy. This week’s lecture was delivered by professor @allbert and the topic was on Trading with Accumulation/ Distribution (A/D) indicator. After going through the lecture carefully I decided to try my hands on the given task.
1- Explain in your own words what the A/D Indicator is and how and why it relates to volume. (Screenshots needed).
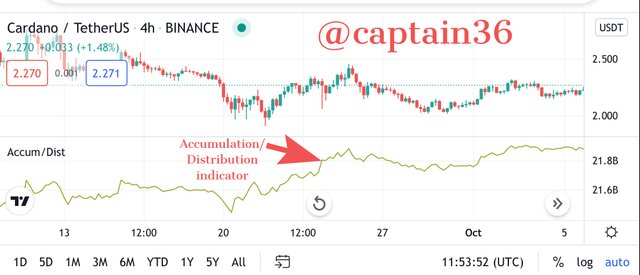
To determine whether a stock is accumulated or distributed, the Accumulation/ Distribution indicator is used. The indicator does this by using the price and volume of the stock at a particular time. This indicator determines the strength of an asset in the market and also points out divergence in the market. The market of assets is affected by demand and supply in the market. This demand and supply attributes are also identified by the A/D indicator. The A/D indicator is also able to identify bull and bear markets. When the indicator rises, it gives a signal of an uptrend and similarly, when the indicator falls downward, it gives a signal of a downtrend.
Screenshot from Tradingview
The Accumulation/ Distribution indicator is very effective in predicting the change of prices of assets in a market. When the A/D indicator rises, it is an indication that the price of the market is on an uptrend and likewise when the A/D indicator is falling downward, it is a signal that the market is in a bearish period. However, when the A/D indicator is moving upward whilst the market is on a downward trend, it shows that there is buying pressure in the market and for that matter the price is likely to reverse and move in an uptrend within a short time. Similarly, when the A/D Indicator falls downward and the market is still on an uptrend, it shows that there is selling pressure in the market and for that matter the price will reverse soon and move in a downward direction. It might also be an indication of a higher distribution.
The strength in the movement of the indicator determines the strength in the movement of the market as well. In this we can say that the strength of the A/D indicator is directly proportional to the strength of the market, whether it’s a bullish movement or a bearish movement.

2- Through some platforms, show the process of how to place the A/D Indicator (Screenshots needed).
I will be using Tradingview to demonstrate this part.
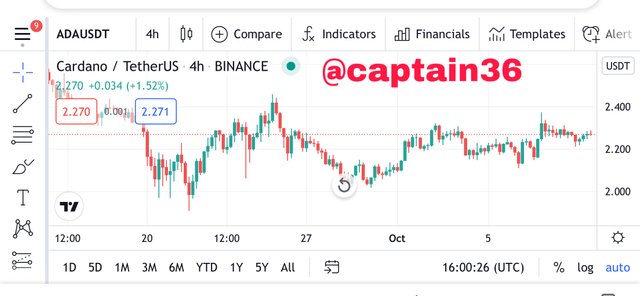
Screenshot from Tradingview
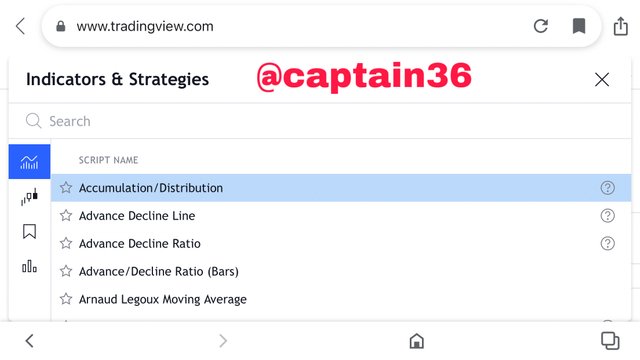
Then you click on the indicator button above and then search for Accumulation and Distribution indicator. Then click on it.
Screenshot from Tradingview
The A/D indicator has been applied in the chart above.

Screenshot from Tradingview
We can see from the chart above that When the A/D indicator rises, the price of the market makes an uptrend and likewise when the A/D indicator is falling downward, the market also falls. However, when the A/D indicator is moving upward whilst the market is on a downward trend, it shows that there is buying pressure in the market and for that matter the price is likely to reverse and move in an uptrend within a short time. Similarly, when the A/D Indicator falls downward and the market is still on an uptrend, it shows that there is selling pressure in the market and for that matter the price will reverse soon and move in a downward direction. It might also be an indication of a higher distribution.

3- Explain through an example the formula of the A/D Indicator. (Originality will be taken into account).
To derive the formula of A/D indicator we need some parameters to able to do that.
At the first place we have to get the Money Flow multiplier. And in calculating the multiplier, the parameters we need are close, low, and high prices of the most recent asset.
The formula below is used to calculate the multiplier.
Money Flow Multiplier = [(Close - low) - (High - Close)] / (High - Low)
Now we will use the Money flow multiplier derived above to calculate the money flow volume. The volume of the period will also be used here.
The formula is below:
Money Flow Volume = Money Flow Multiplier x Period Volume.
The A/D is obtained by adding the Money Flow volume to the previous A/D. The formula is seen below.
A/D = Money Flow Volume + previous A/D
Example
ADA/USDT
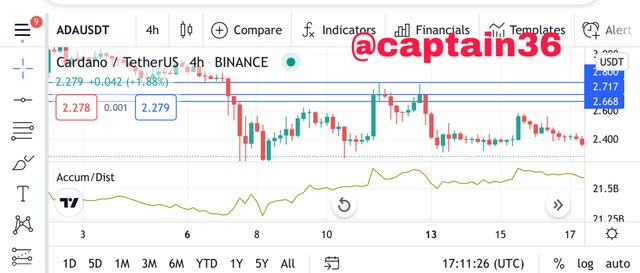
Screenshot from Tradingview
Closing price = 2.717
Low price = 2.668
High price = 2.80
Period volume = 21.6
Now let’s calculate the MFM by using the formula.
MFM = [(2.717 - 2.668) - (2.80 - 2.717)] / (2.80 - 2.668)
MFM = (0.049 - 0.083)/ 0.132
MFM = -0.257
Now time to calculate the MFV.
We can remember that the MFV formula is as follows;
MFV = Period volume x MFM
MFV = 21.6 x (-0.257)
MFV = -5.55
Now since this is the first indicator value we use the MFV as the last A/D value.
MFV + Last A/D value
-5.55 + (-5.55) = -11.1

4- How is it possible to detect and confirm a trend through the A/D indicator? (Screenshots needed)
Identifying Bullish Trends
Bullish trend is identified with the A/D indicator when the indicator moves upward, during the movement of the price of the asset. Though the price of the asset could be seen moving downward, the A/D indicator still moves upward to give a sign of a bullish trend. This type of signal is called the divergence signal. In this case, the indicator shows that there is increasing buying pressure whilst the selling pressure is being weakened. After this signal shows, in short time the price of the asset is seen to have reversed from a downtrend to an uptrend.
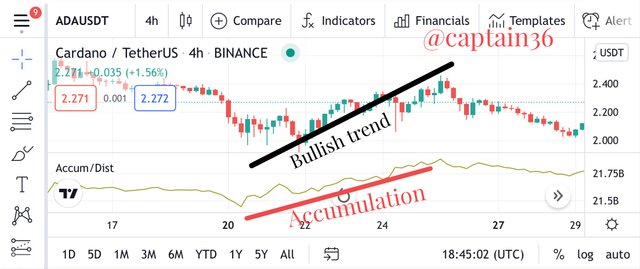
Screenshot from Tradingview
Identifying Bearish Trends
The price of an asset can be moving upward whilst the A/D indicator is moving downward. In this case the indicator is giving a bearish signal. This movement of the indicator is an indication that the selling pressure has increased in the market and there will be a bearish trend very soon.
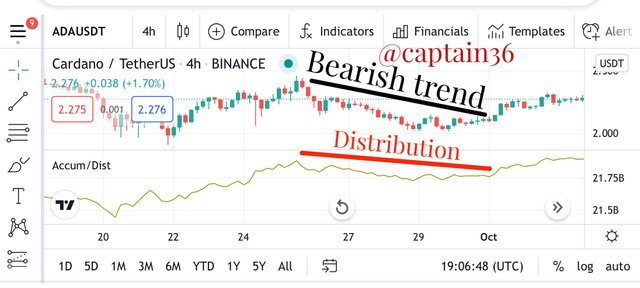
Screenshot from Tradingview

5- Through a DEMO account, perform one trading operation (BUY or SELL) using the A/D Indicator only. (Screenshots needed).
The first thing we have to do is to look for the price trend of the asset. After confirmation of the price, this will help us to know whether the market is on an uptrend or a downtrend. Then after knowing the trend, we can decide to apply divergence. The divergence we will apply should be studied for some reasonable amount of time.
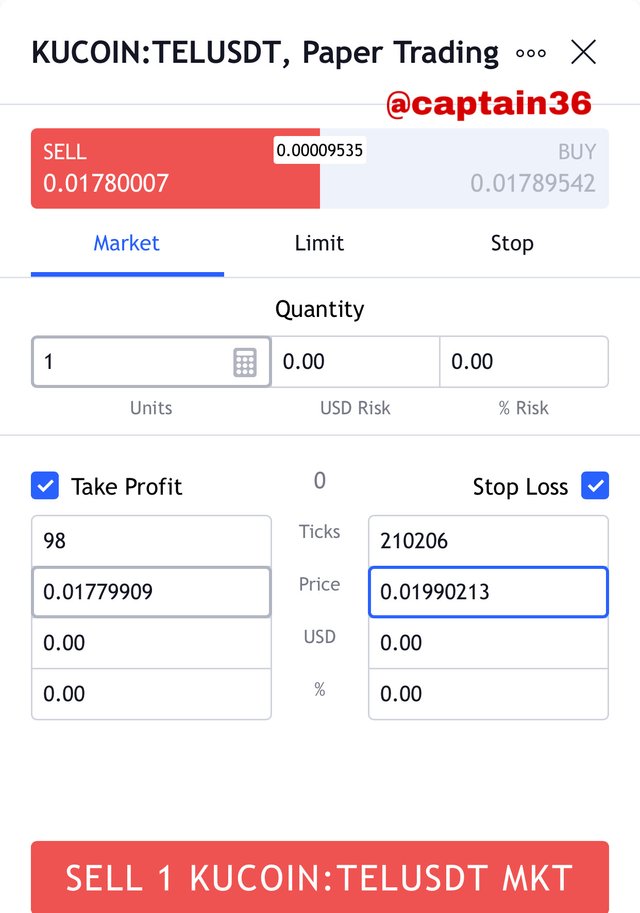
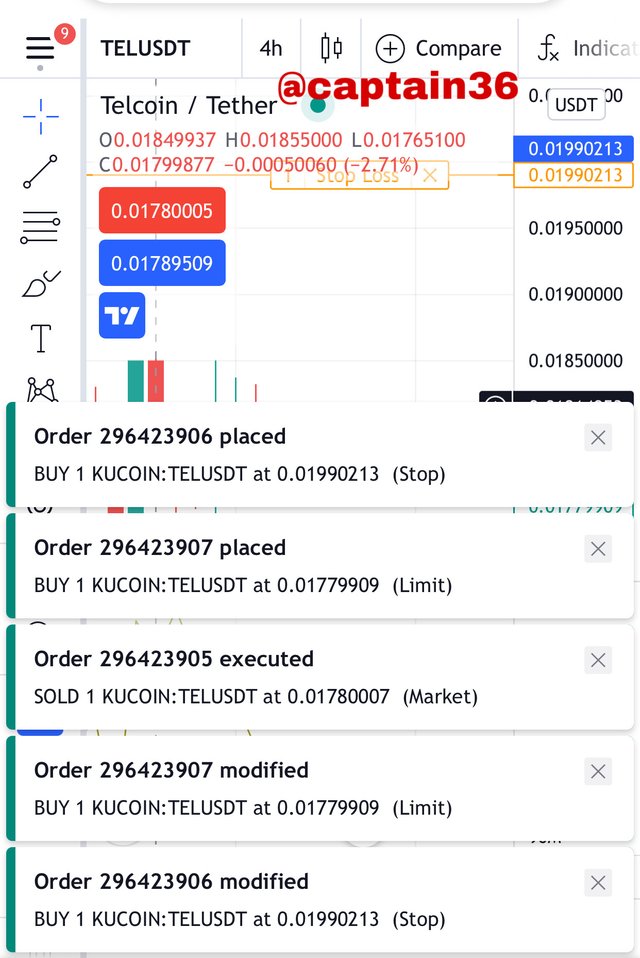
I will be using Telcoin to demonstrate this. I will perform a buy of TEL/USDT pair.
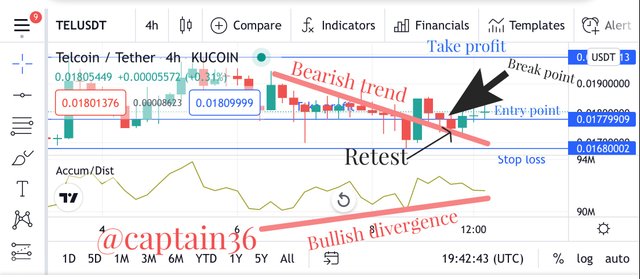
Screenshot from Tradingview
As discussed in the lesson already, I had to observe the trend very well and I saw a bearish trend. After that I established a bullish divergence and placed my order in that direction. I then set stop loss and take profit .
Screenshot from Tradingview
Screenshot from Tradingview
As seen in the screenshots above I have placed an order of TEL/USDT on KuCoin trading. The stop loss is 0.01990213 and the take profit is 0.01779909. The fill price is 0.01780007.

6- What other indicator can be used in conjunction with the A/D Indicator. Justify, explain and test. (Screenshots needed).
We all know that indicators are very effective when we combine them and use them together for the prediction of market prices. The results of using only one indicator can be misleading sometimes.
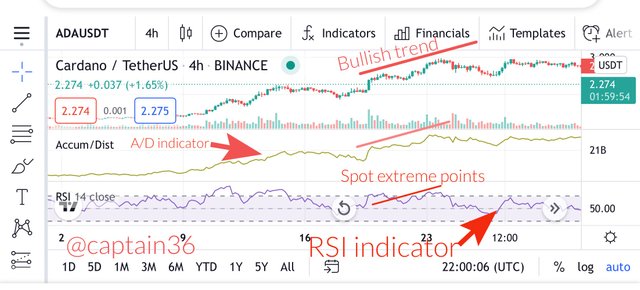
So in this demonstration I combined the A/D indicator with the Relative Strength Index.
The RSI indicator has the ability to calculate the loss and gains of recent assets. The RSI is able to compare gains and loss and used to predict the future of the market. The overbought and oversold conditions in the market can be measured using the RSI indicator. So using the RSI with other indicators will help to make a good prediction of the market. RSI in this case will make up for the features that the A/D indicator cannot measure.
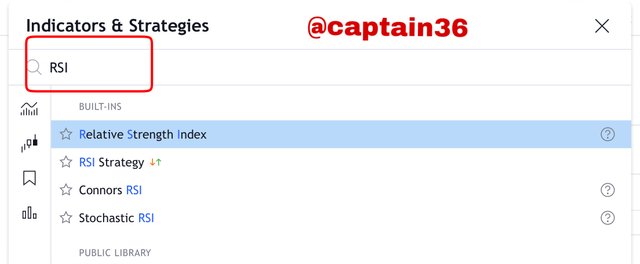
We already discussed how to add indicators. So I opened Tradingview and then added the RSI indicator following the same procedure. I added it to the chart which I already added the A/D indicator.
Screenshot from Tradingview
Screenshot from Tradingview
Looking at the screenshot above, we realise that the RSI indicator is able to stretch to the very extreme. This means the RSI is able to predict the price to the extreme points. But the A/D indicator is not able to reach the extreme. This is a vindication that combination of two indicators will work out properly to bring good results.

Conclusion
The A/D indicator is very good for spotting changes in prices of assets. This indicator is very efficient in measuring price reversals and when combined with other indicators, we are able to predict the prices of assets very well.
Thank you once again professor @allbert for this detailed lecture.