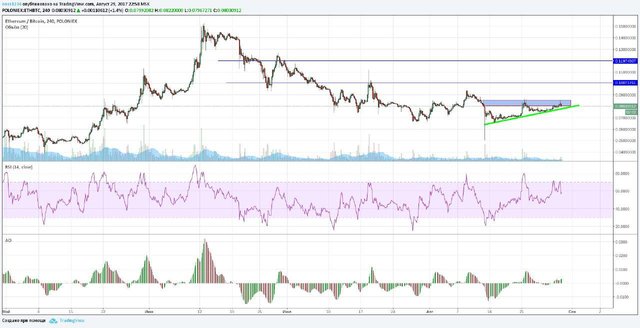
Coin chart. ETH in triangle
Hello people. Today lets talk about Etherium
https://ru.tradingview.com/x/EQEYY7Ul/

As we can see at the chart, ETH in Ascending Triangle. This means that soon price will move up. Also big news will be soon. So my first target is 0.1, there we can see resistalce level. Then, 0.12 is next target. After the breakout of 0.12 level price can skyrocket to ATH.
Still rather skeptical of TA.... seems like a hit or miss. But hey, totally hope what you say is going to happen :)
thanks for responce)
thanks for sharing
enjoy)
cool story, bro
i think so
i have some ETH, thanks
good luck)
I think you're right
thanks)
sounds nice. we will see...
good luck to ETH and us)
lets see, what will be
lets see
Congratulations @burmik123! You have completed some achievement on Steemit and have been rewarded with new badge(s) :
Click on any badge to view your own Board of Honor on SteemitBoard.
For more information about SteemitBoard, click here
If you no longer want to receive notifications, reply to this comment with the word
STOP