Steemit Crypto Academy | Season 3 | Week 7 - Homework Post For Professor @yousafharoonkhan
Hello, professor @yousafharoonkhan, I am glad to be part of your lecture and I present to you my homework post about how to create an account on TradingView, how to use indicators, tools, and features of TradingView that you laid out to the steemians.
Define the trading view site and how to register an account in TradingView. What are the different registration plans? (screenshot necessary)
TradingView is a general term used to describe an online community that is composed of traders who want to get vast knowledge about the financial markets, that is to say, it is a web-based platform that has a robust set of tools and options to help traders in performing technical analysis to know the market trends of an asset.
TradingView not only has the technical analysis tools but also gives different traders the opportunity to chat and share their analysis or ideas with other traders around the globe so that other traders can check out if the analysis will come through or will flop.
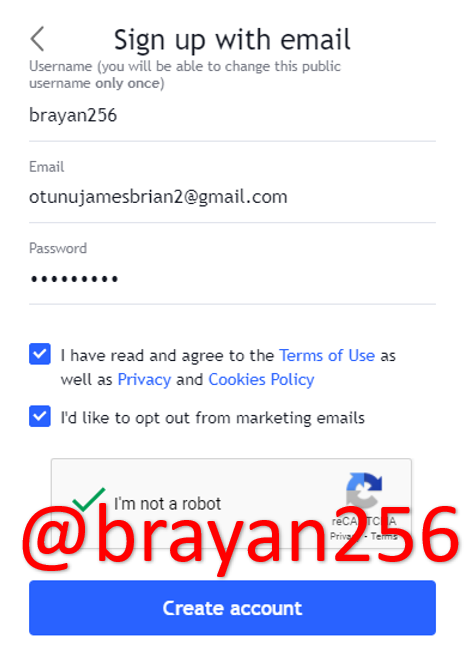
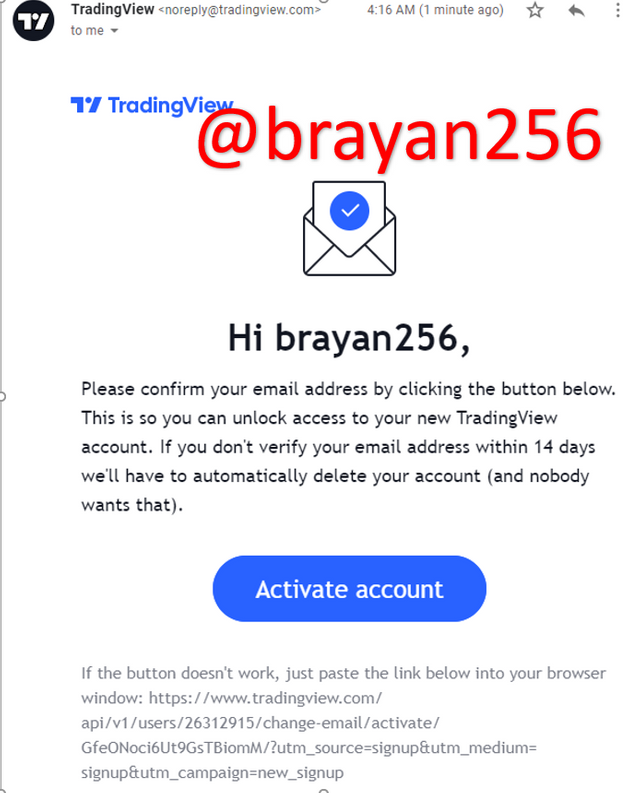
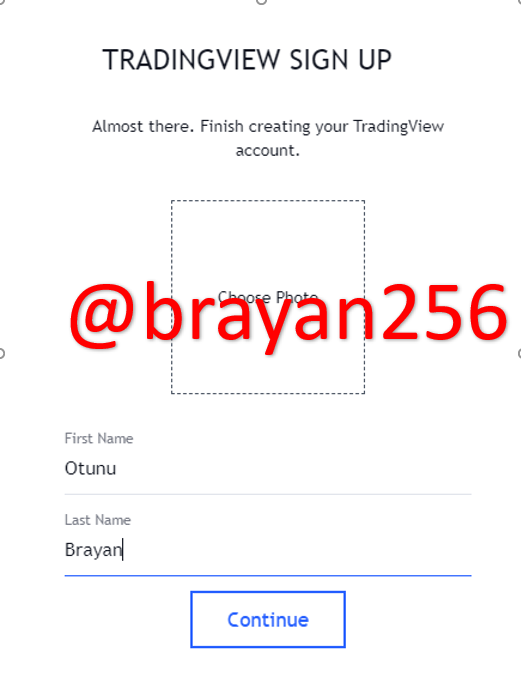
How to create an account on TradingView.
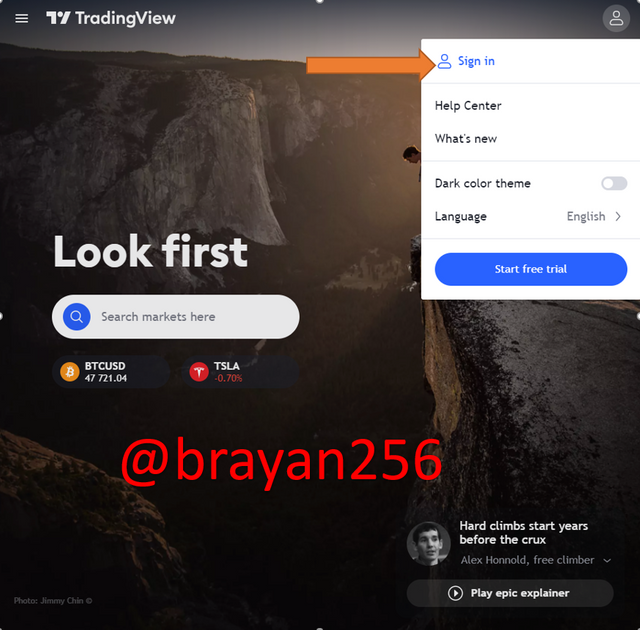
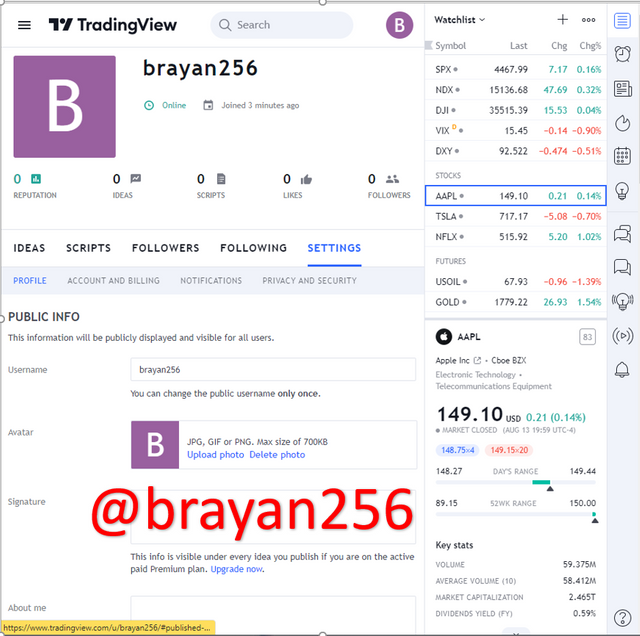
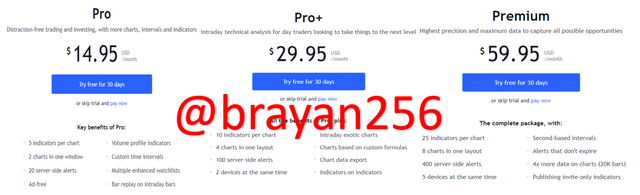
What are the different registration plans?
TradingView offers four plans with more features available depending on the expense of the account which is charged monthly or annually, that is, the basic subscription which is free, the Pro subscription that costs $14.95, the Pro+ subscription which costs $29.95, and the Premium subscription which costs $59.95 monthly.
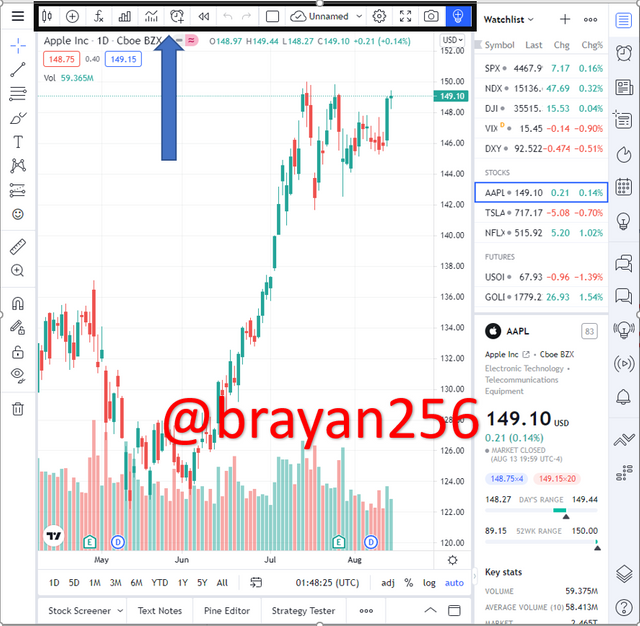
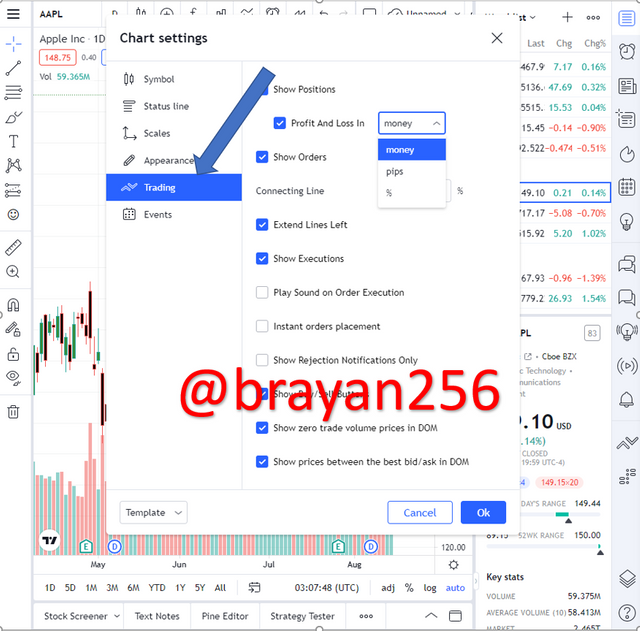
Explain the different features of trading view and what is your favorite feature and why? (screenshot necessary)
There are several features of TradingView and I will be discussing the following features on the web-based platform.
Charts.
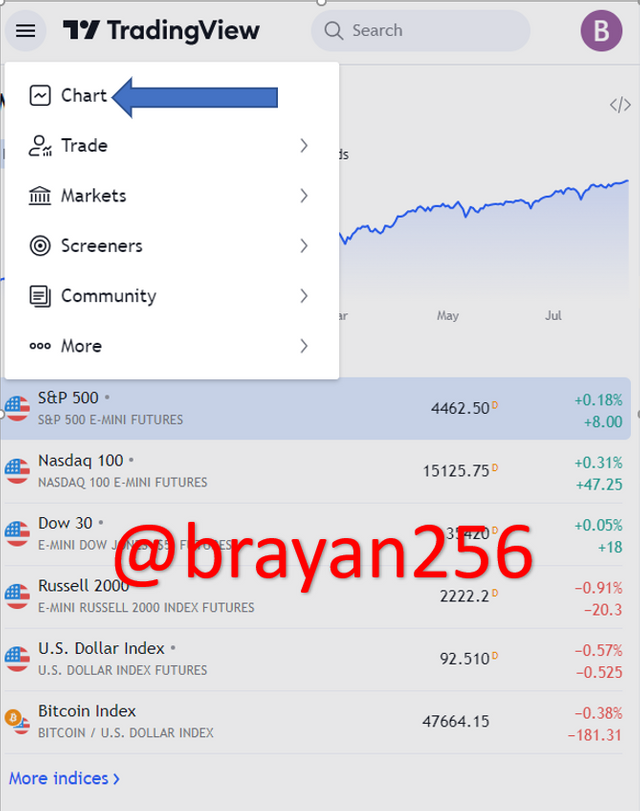
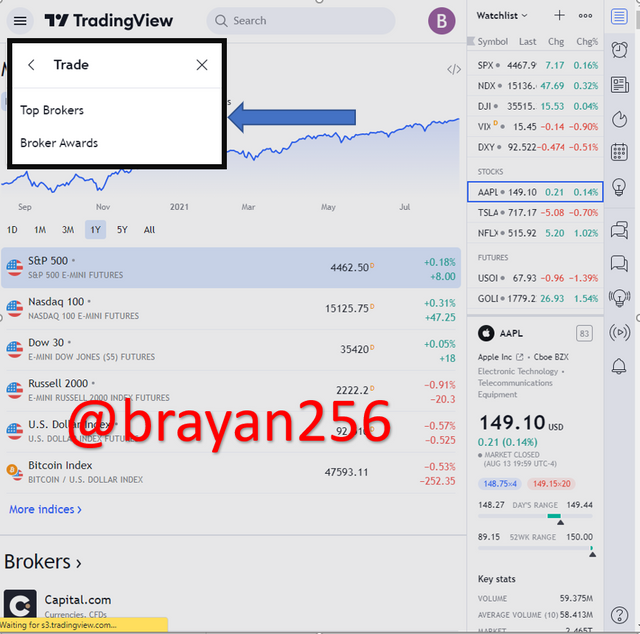
Trade.
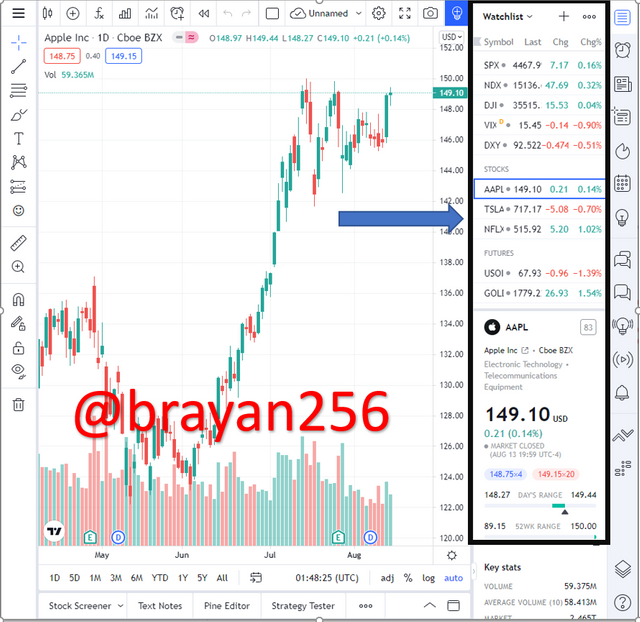
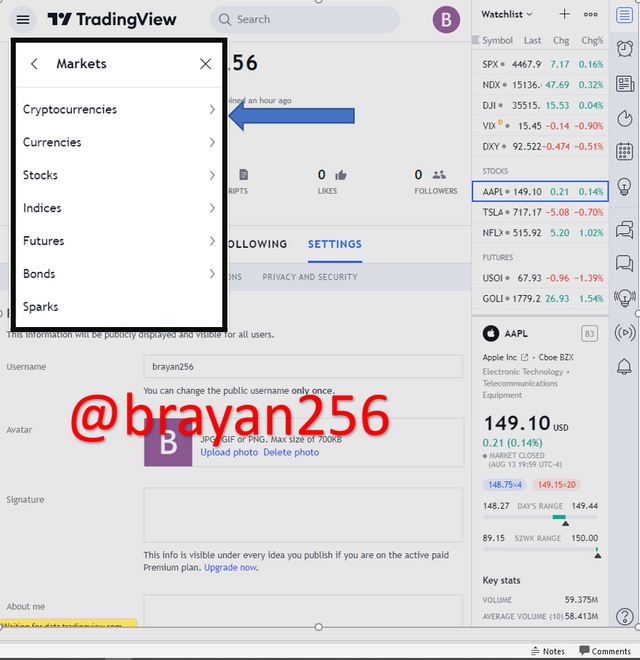
Markets.
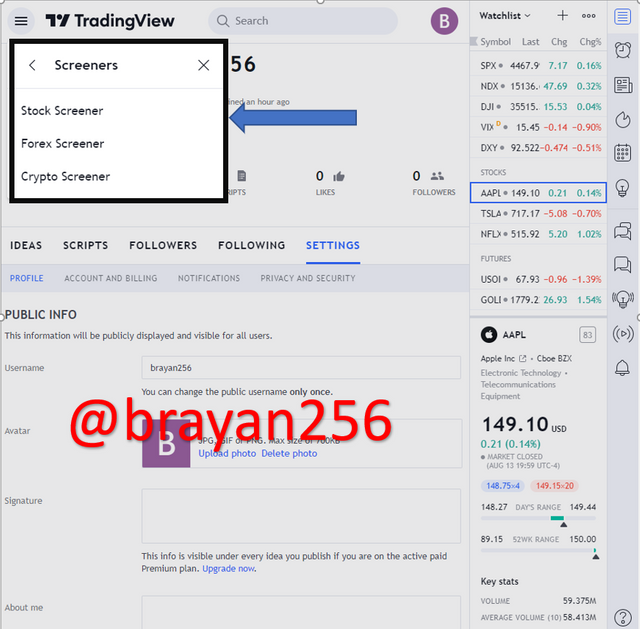
Screeners.
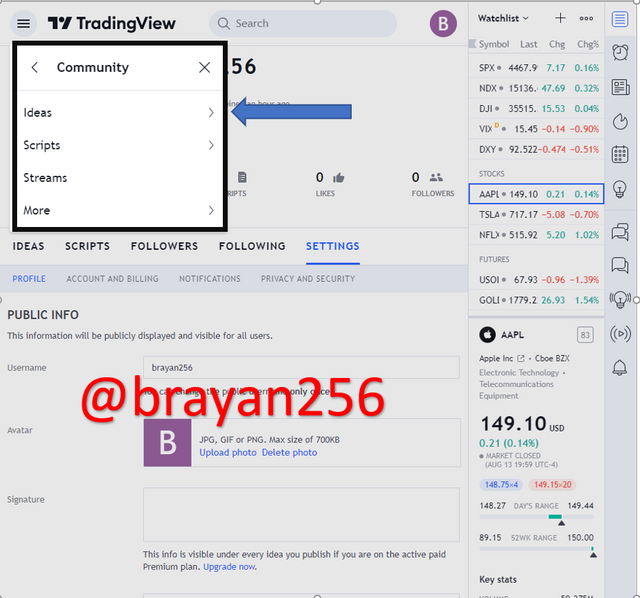
Community.
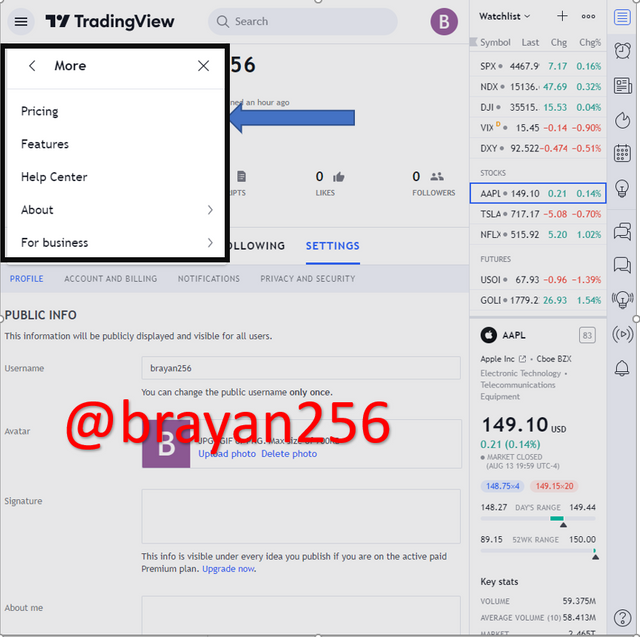
More.
Favorite feature.
My favorite feature on TradingView is the community. This is because I have attained vast knowledge from the platform through the community feature, that is to say, I have been able to follow up with some of the top-ranked authors and analysts who share their knowledge and analysis about a particular asset. The community has also introduced to me new trading tools and strategies to analyze the financial markets to know which ones favor my trading plan. Sharing of knowledge is key in being a successful trader, the fact that new tools and strategies are being developed every day.
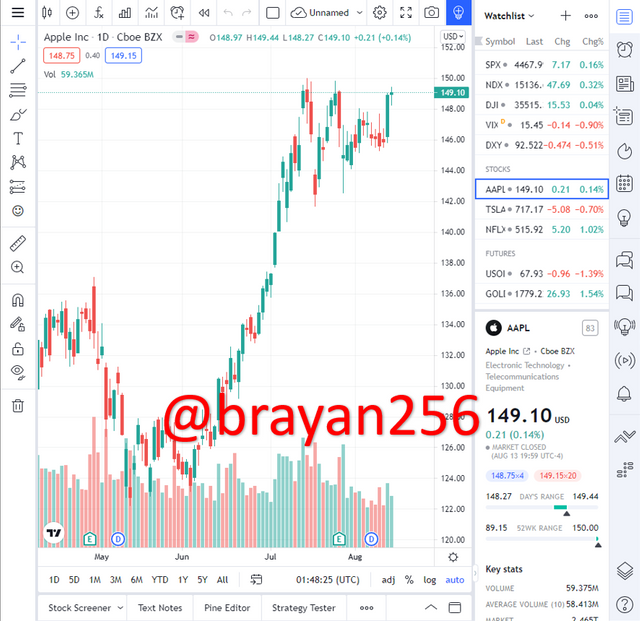
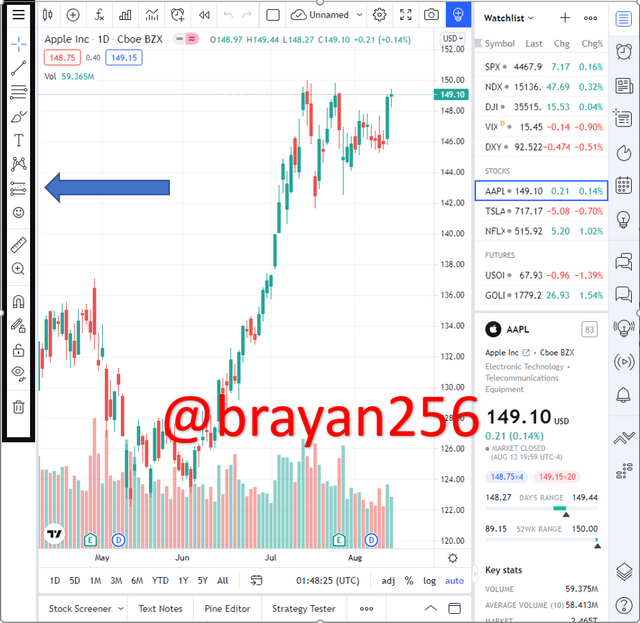
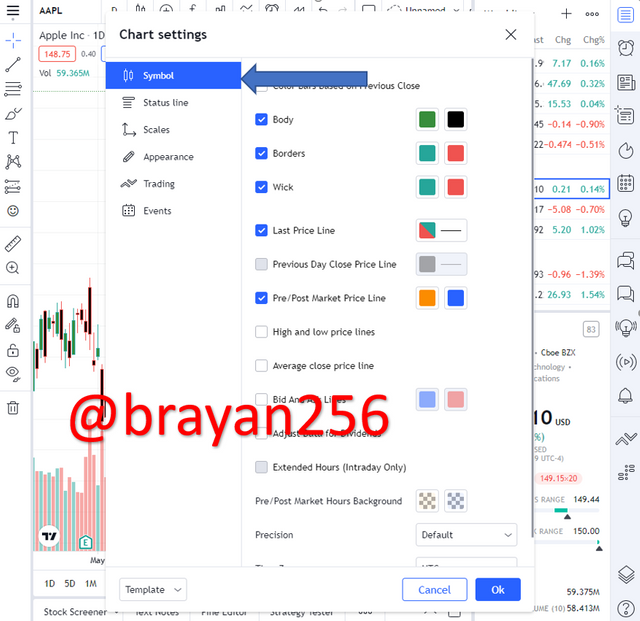
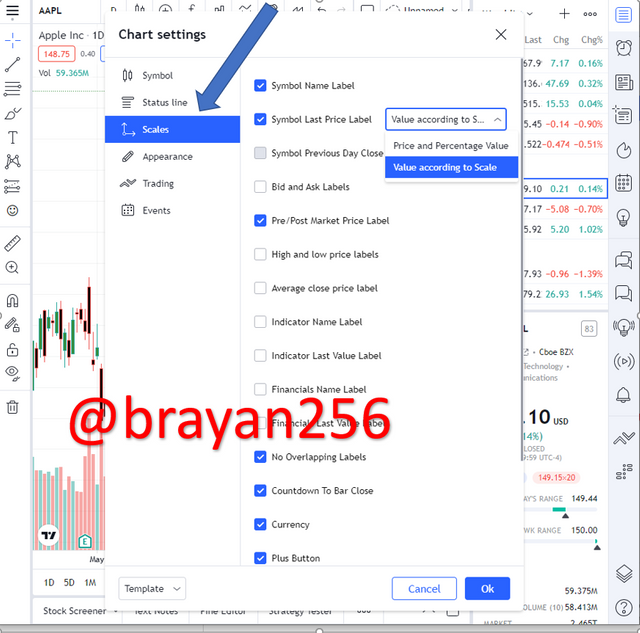
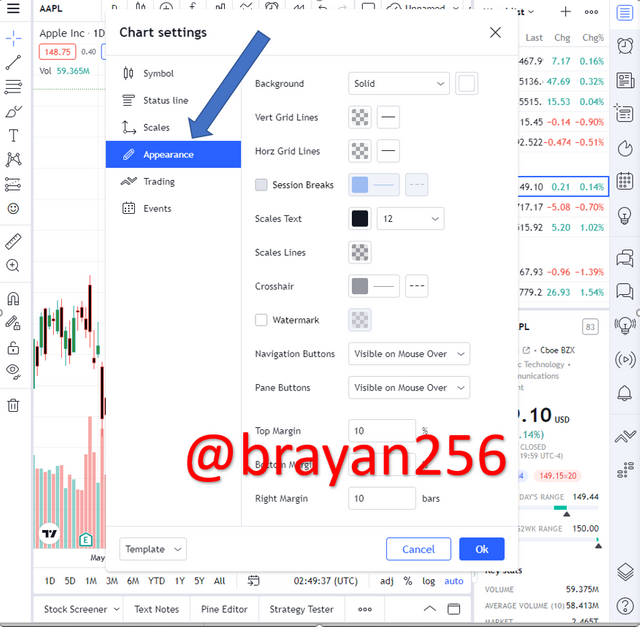
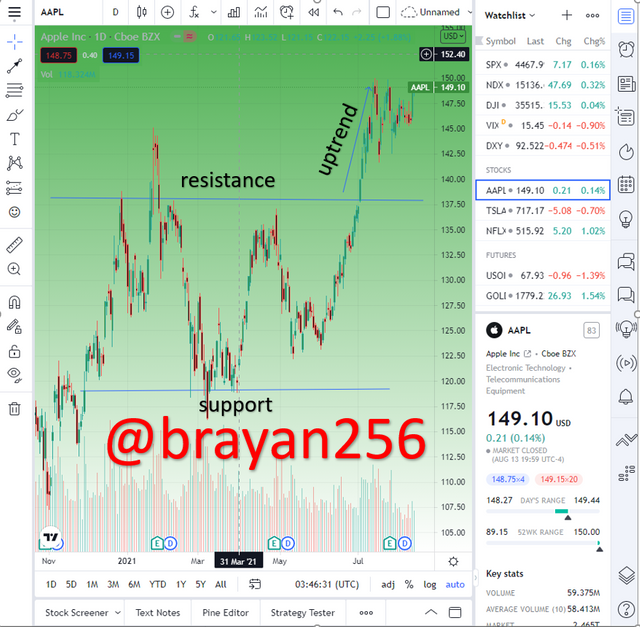
How to set up a chart in TradingView and use two tools to edit it. (screenshot necessary)
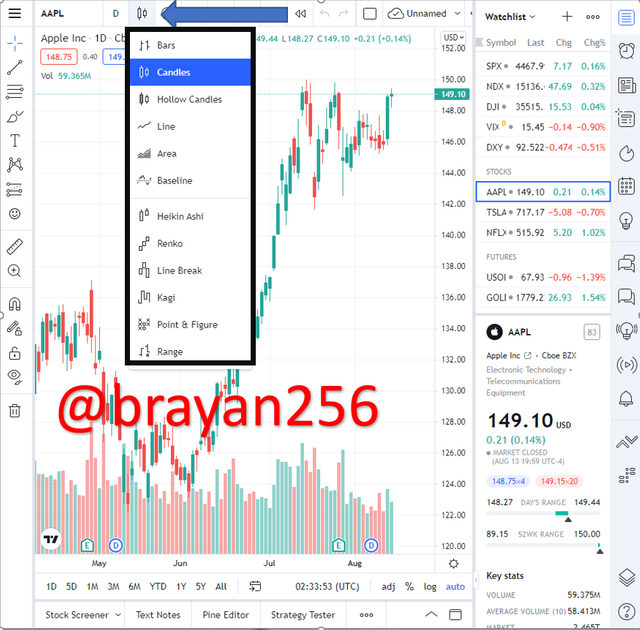
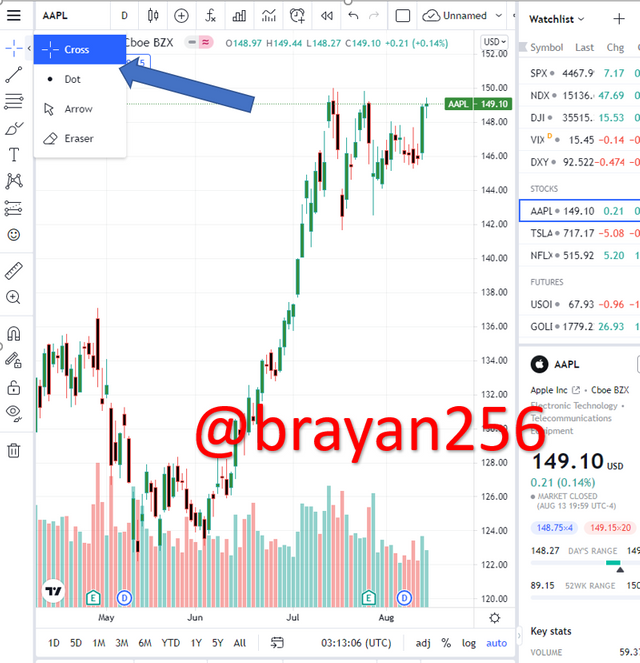
I used two tools to edit my chart on TradingView which included a trendline to mark the support and resistance level and an arrow to show the direction of the market.
Explain how to add an indicator in the chart, what is your favorite indicator, and why. (screenshot necessary)
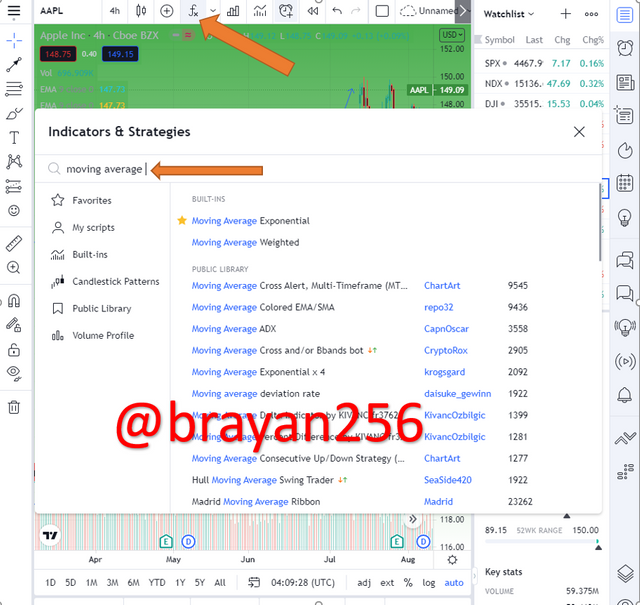
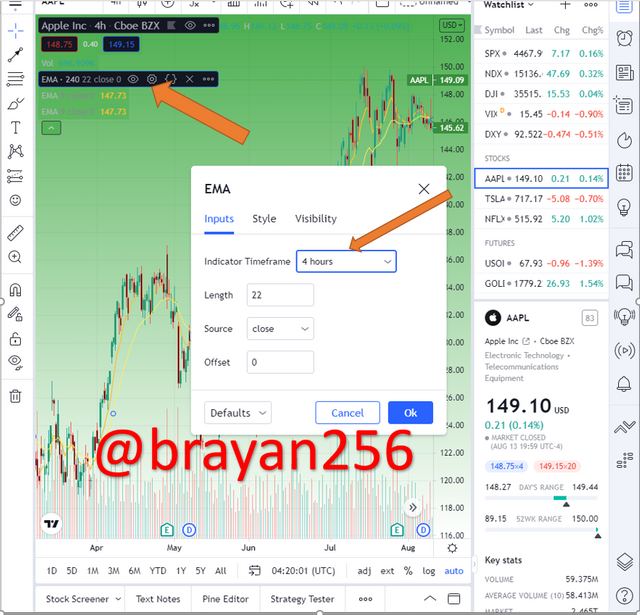
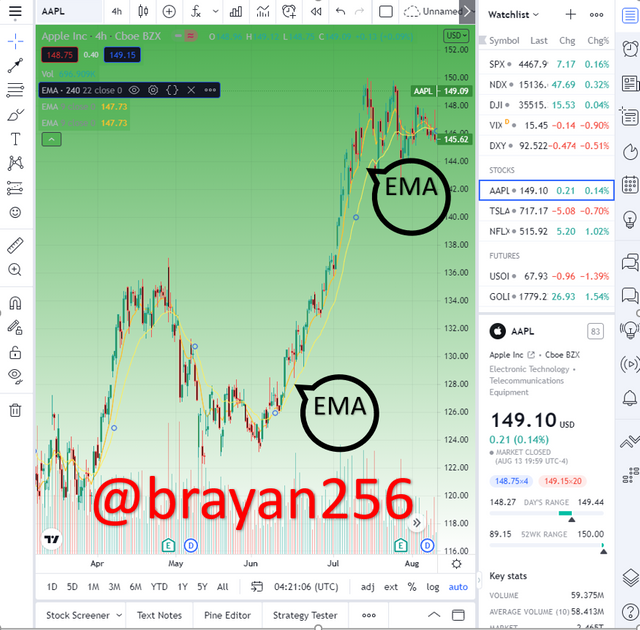
My all-time favorite indicator has always been the moving averages. This is because the moving averages indicate the direction where the market is going whether an uptrend or downtrend direction, that is, it helps acknowledge a trade an exit point in a trade or an entry point in the trader. This has reduced the massive losses and increased profits.
Do you think TradingView is useful in predicting the market for cryptocurrency (trend/price)?
According to the 4 years, I have spent using the TradingView website, I agree that the website is a convenient platform in predicting the market for cryptocurrency. In this sense, TradingView has several tools and indicators that help cryptocurrency traders to analyze and know the trend and movements of the market.
TradingView also has the screener feature which helps traders to know what exactly is going on in the cryptocurrency market from showing the performance of the different assets to showing the trend of the markets which has made it easier to predict the cryptocurrency markets.
Conclusion.
TradingView doesn’t only provide grounds for creating charts but also provides the social aspect where people get to share ideas and analysis to the community which distinguishes it from other charting platforms thus creating more grounds for newbies to learn about trading in the financial markets. Therefore, I would like to thank professor @yousafharoonkhan for such a wonderful lecture about TradingView.
Respected first thank you very much for taking interest in SteemitCryptoAcademy
Season 3 | intermediate course class week 7
you tried best thank you very much for joining this class
You have been curated by @yohan2on, a country representative (Uganda). We are curating using the steemcurator04 curator account to support steemians in Africa.
Keep creating good content on Steemit.
Always follow @ steemitblog for updates on steemit