[Heikin-Ashi Trading Strategy]-Steemit Crypto Academy | S4W2 | Homework Post for @reddileep
QUESTION 1
Define Heikin-Ashi Technique in your own words.
Heikin-Ashi Trading Technique.
The heikin-ashi is a technique based on the Japanese candlestick pattern. The heikin-ashi uses the candlestick charts to represent and visualize market price data.
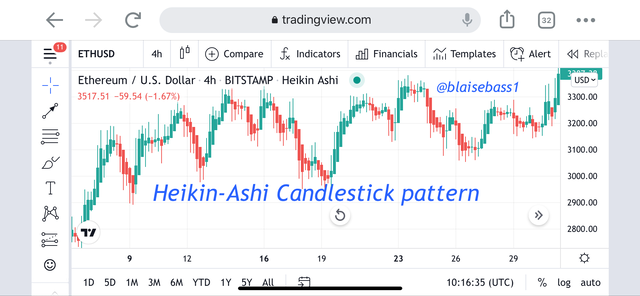
Explaining the functioning of the heikin-ashi, we see that it takes advantage of the price data in filtering the noise in the market. When we have the absence of noise in the market, we see a clear view on the of the market as shown on the screenshot below.
The heikin-ashi technique was developed by Munehisa Homma in the 1700’s
Trying to translate the heikin-ashi to English, we see that the Heikin means average and the Ashi means balance
Joining all together, the word heikin-ashi means average balance.
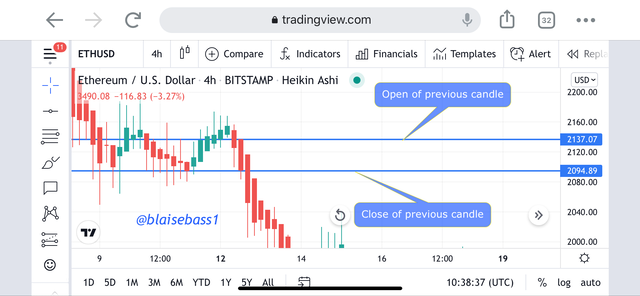
The heikin-ashi takes into consideration the aspect of open and close data from previous period and also the open-high-low-close data of the current data.
Normally, the heikin-ashi uses the open of the previous candlestick and the close of the previous candlestick as well as the open, close, low, and close of the current candlestick. This will be explained vividly below.

QUESTION 2
Make your own research and differentiate between the traditional candlestick chart and the Heikin-Ashi chart. (Screenshots required from both chart patterns)
Difference between Traditional Candlestick and Heikin-Ashi Candlestick
Smoothness
I will begin by taking a view on the charts of the candlesticks of both the heikin-ashi and the traditional candlestick.
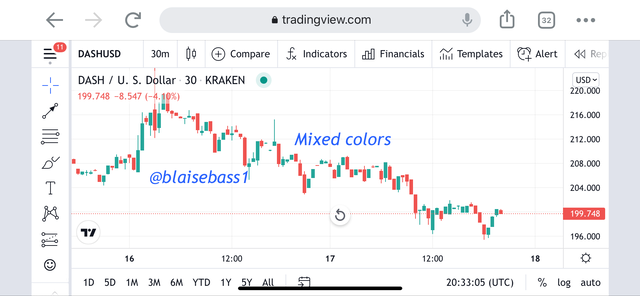
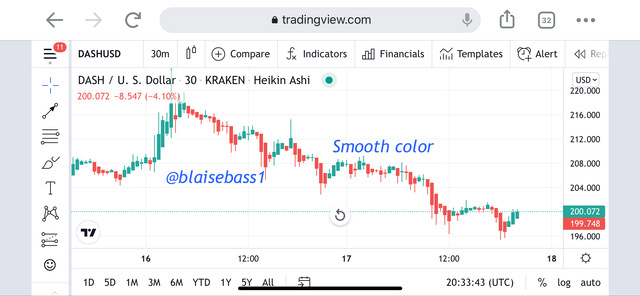
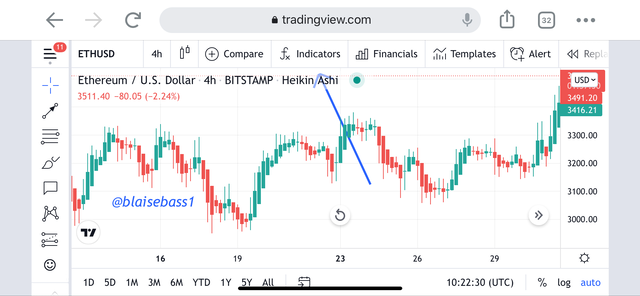
Looking at the heikin-ashi, we see that the chart looks smoother while that of the traditional candlestick does not look smooth. This is explained in the screenshots below.
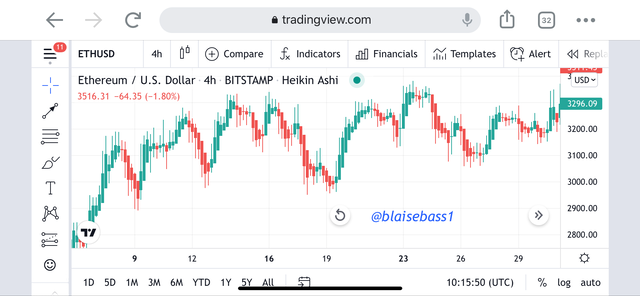
Heikin-Ashi shows a smooth chart
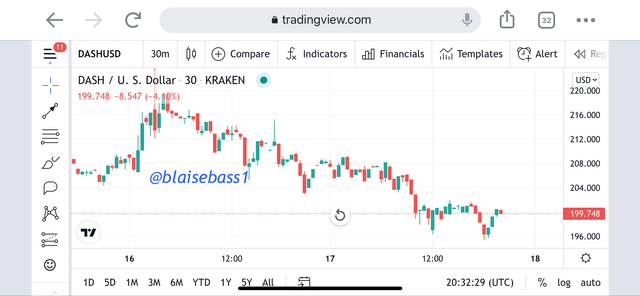
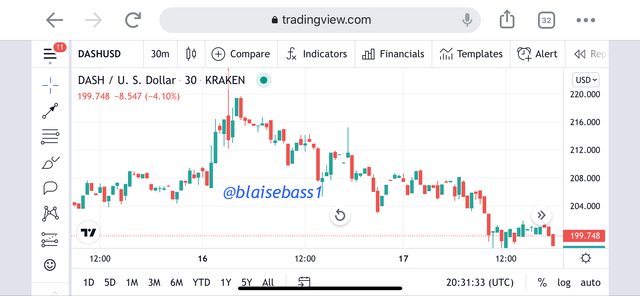
The traditional Candle stick looks very un smooth
Trend Identification
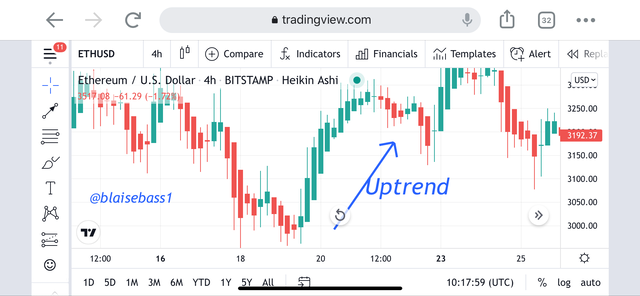
It is always important to know the current of a particular asset or the market before trading. It is then noticed that that the heikin-ashi provides a general view of the trend more vividly than the traditional candlestick pattern. This is shown in the screenshot below.
We can easily see and identify the trend
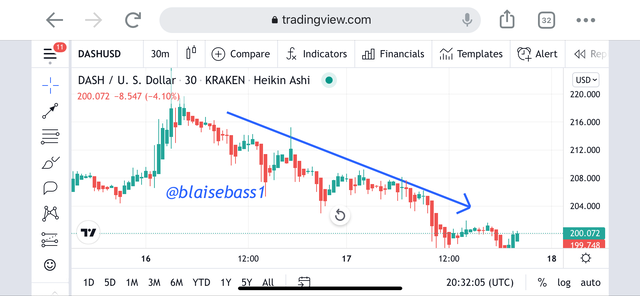
trend cannot be easily identified
Calculations
Candlesticks are created by calculations in the heikin-ashi while in the traditional candlestick a new candlesick starts exactly at the close of the previous candlesick.
Colour Changes
The colour of the candlestick in the heikin-ashi candlestick chart changes only when there is a clear market trend while in the traditional Japanese candlestick chart, we have colour changes more frequent which are due to any slight change in the trend of the market.
The Heikin-Ashi shows smooth colors

QUESTION 3
Explain the Heikin-Ashi Formula. (In addition to simply stating the formula, you should provide a clear explanation about the calculation)
Heikin-Ashi Fomula
Calculations:
- The heikin-ashi open
- The heikin-ashi close
- The heikin-ashi high
- The heikin-ashi low
The heikin-ashi close
Open + high + low + close / 4
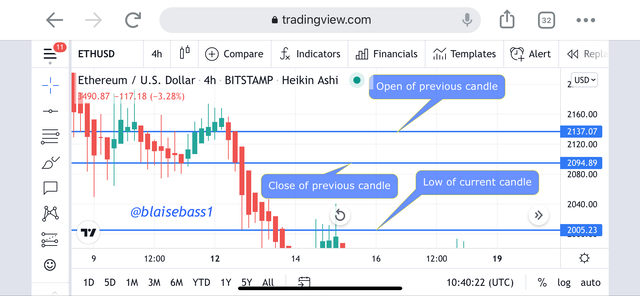
2137.07 + 2094.89 + 2005.23 + 2137.01 / 4
2093.56
the heikin-ashi open
HA open + HA close / 2
2137.07 + 2094.89 / 2
2115.98
Heikin-ashi high
max (high0, HA open, HA close0)
Heikin-ashi low
min (low0, HA open0, HA close0)

QUESTION 4
Graphically explain trends and buying opportunities through Heikin-Ashi Candles. (Screenshots required)
Explanationing graphically the trends and buying opportunities with the Heikin-ashi candles
1) Trend Strength
We can use the heikin-ashi candlesticks to measures the strength of a trend. I will be explaining in the bullish and the bearish scenario.
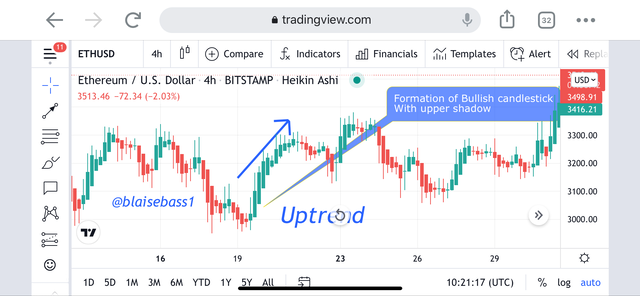
Bullish Trend
A Bullish Trend is noted by the presence of consecutive and continuous green candlesticks without the formation of lower shadows. We can see this in the screenshot below.
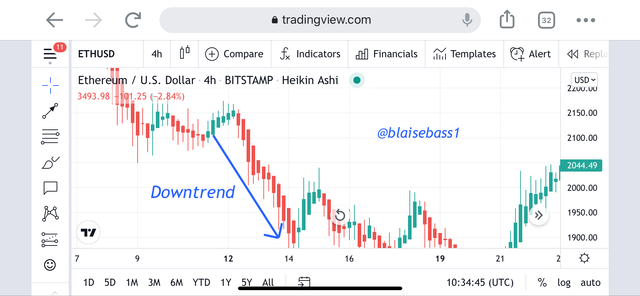
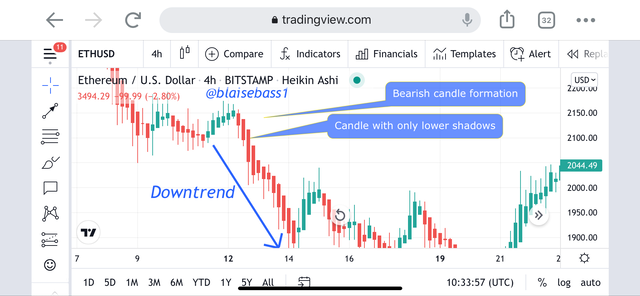
Bearish Trend
A Bearish Trend is noted by the presence of consecutive and continuous red candlesticks without the formation of higher shadows. We can see this in the screenshot below.
2) Trend Reversal
We can use the heikin-ashi to spot trend reversals in the prices of an asset. This can be located through the following below.
Identification of candlesticks with no shadow: we see this when we have a sequence of candlesticks and this candlestick appear with no upper shadow, i
Also, we have the formation of candlesticks with small bodies. This also indicates a trend pause or a reversal.

QUESTION 5
Is it possible to transact only with signals received using the Heikin-Ashi Technique? Explain the reasons for your answer.
Possibility of transacting only with the Heikin-ashi
In my own point of view, I will say it is possible to use only the heikin-ashi strategy. But as the trading managements says it is preferable to have multiple confirmations before actually engaging in a signal. It is for this reason that I will be saying it is important to use the heikin-ashi with other confirmations.
I will begin by adding the EMA to my chart
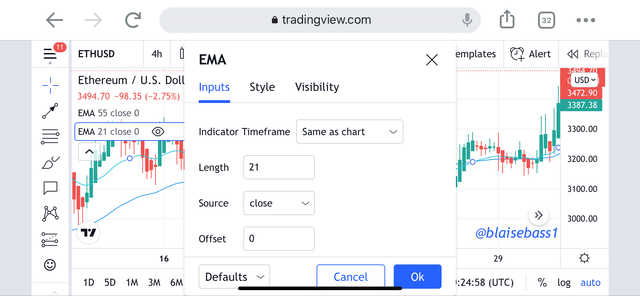
Step 1
We enter the tradingview.com site and click on the indicator tap
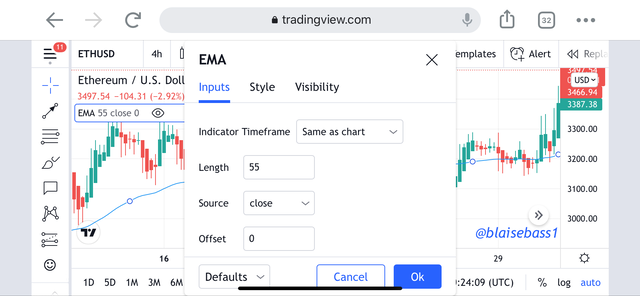
Step 2
We then search the EMA and configure it to 55EMA and 21EMA
Strategy
Buy Order
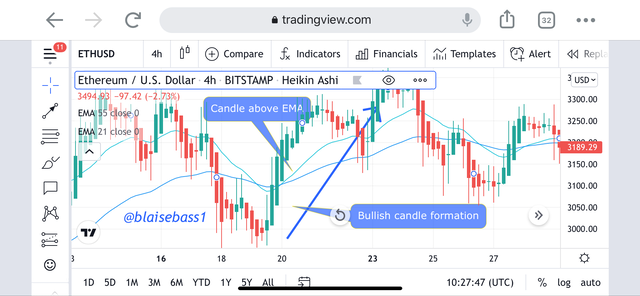
For a buy order, when prices are above the 55-EMA and the 21-EMA, this shows a confirmation entry for buy. We then confirm this by the formation of the bullish candlesticks with only upper shadows after an indecisive period.
SELL Order
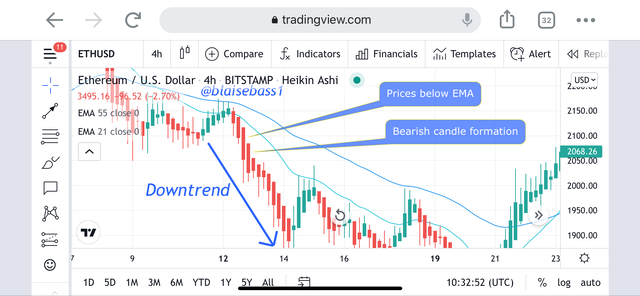
For a sell order, when prices are below the 55-EMA and the 21-EMA, this shows a confirmation entry for sell. We then confirm this by the formation of the bearish candlesticks with only downward shadows after an indecisive period.

QUESTION 6
By using a Demo account, perform both Buy and Sell orders using Heikin-Ashi+ 55 EMA+21 EMA.
Buying the dash/usd pair
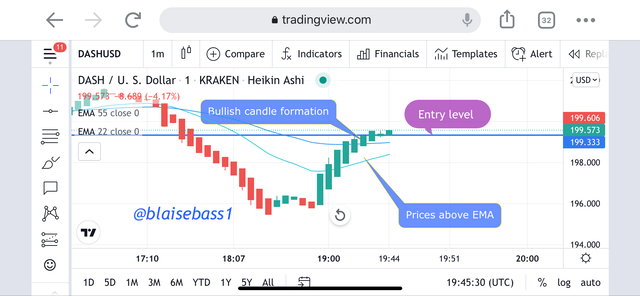
Trade Entry
For a proper entry, when prices are above the 55-EMA and the 21-EMA, this shows a confirmation entry for buy. We then confirm this by the formation of the bullish candlesticks with only upper shadows after an indecisive period.
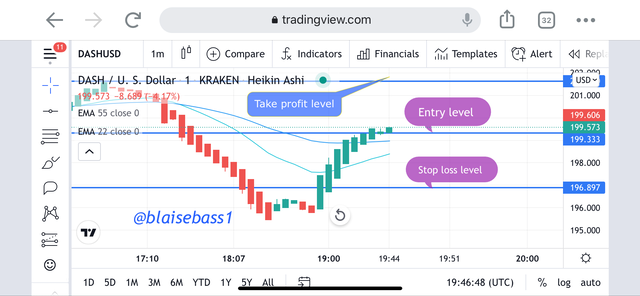
Trade Exit
Exiting is using stop loss and take profit levels. The stop loss level is placed below the EMA’s. And my take profit level is set to a risk to reward ratio of 1:1
Selling the eth/usd pair
Trade Entry
For a proper entry, when prices are below the 55-EMA and the 21-EMA, this shows a confirmation entry for sell. We then confirm this by the formation of the bearish candlesticks with only lower shadows after an indecisive period.
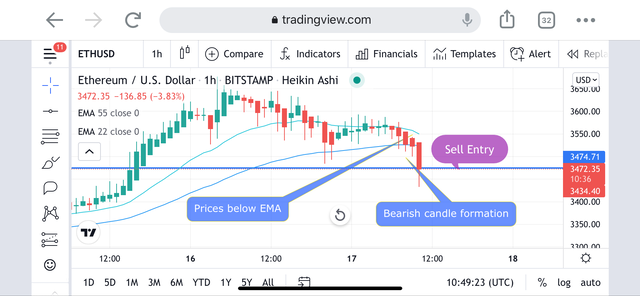
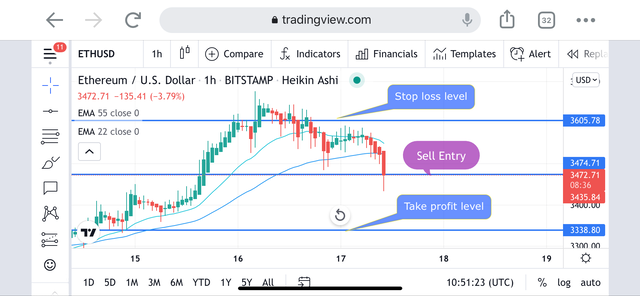
Trade Exit
Exiting is using stop loss and take profit levels. The stop loss level is placed above the EMA’s. And my take profit level is set to a risk to reward ratio of 1:1
Conclusion
As a trader, we can increase our profitability with the usage of the heikin-ashi strategy. With the numerous advantages it posses which include filering out the noise in the market and also providing a clear view of market in terms of smoothness we can actually increase profitability when we add the confirmation of the signals to other indicators such as the EMA
Running Trades
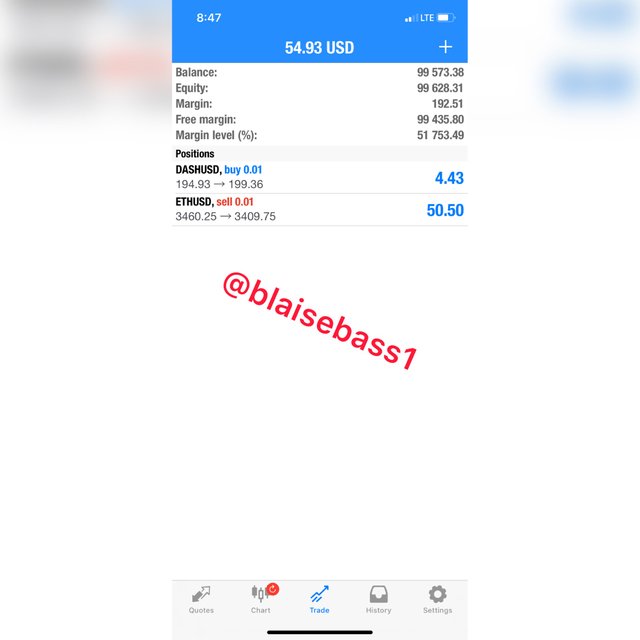
CC: @reddileep