# Technical Analysis of the Steem Price – Buy/Sell Indicators Using MACD
In this post I will discuss a popular indicator used in the field of Technical Analysis to identify buy and sell signals.
The purpose of this post is to introduce you to the concept of MACD (Moving Average Convergence Divergence) and see how it can be applied to the Steem Price movement over time (or any other cryptocurrency). In this analysis, I am using the daily Steem price over the period February to April 2017.
I plan to release regular updates of the MACD on the price of Steem to keep the community informed on how this tool views the current Steem price.
What is the purpose of MACD
The general purpose of MACD is to provide signals to investors that indicate when Steem may be under or over-priced.
Please note this is just an indicator which is based on historic prices. I would therefore treat it with caution if you plan to make an investment decisions based on the signals it produces.
What is MACD
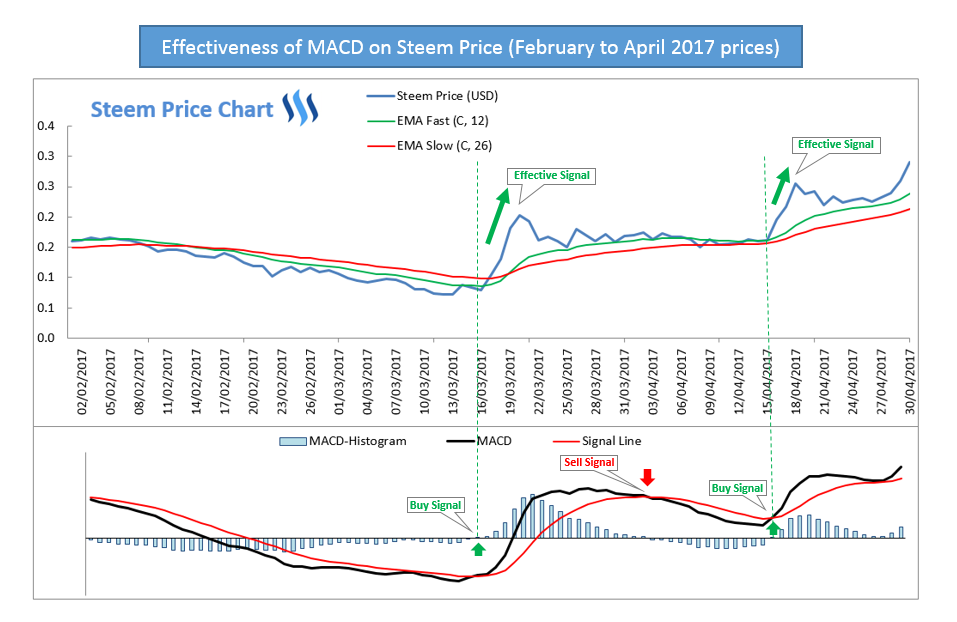
I will explain MACD using experience from the Steem Price movement over the period February to April 2017. The graph below shows everything I will explain in this post so apologies if there is a lot to take in.
Firstly, what is MACD?
Wikipedia describes MACD as…
a trading indicator used in technical analysis of stock prices, created by Gerald Appel in the late 1970s. It is supposed to reveal changes in the strength, direction, momentum, and duration of a trend in a stock's price.
We will look at each component of the MACD separately. The screenshot below shows the lower panel of the above graph.
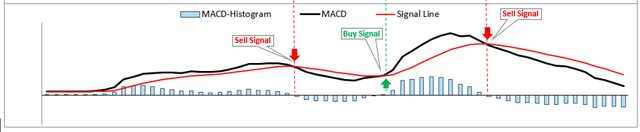
There are three lines shown here: the **MACD-Histogram , ** MACD and Signal line. The formulae for these are:
MACD: (12-day EMA – 26-day EMA)
Signal Line: 9-day EMA of MACD line
MACD Histogram = MACD Line – Signal Line**
Where EMA is the Exponential Moving Average. The N-Moving Average price is average price over the last N days. The exponential moving average is a similar idea but it gives more weight to more recent periods i.e. yesterday’s price will be more influential than the day before, and so on.
The 12-day EMA is what is known is the “fast” moving average. This is the exponential average price over 12 days. The 26-day EMA is what is the “slow” moving average and hence is “slower” to react price movements.
The MACD line is just the difference between the “slow” and “fast” moving average lines. When this is positive it means the average price over 12 days is greater than the average price over 26 days. Another way of interpreting this is that there is an upward momentum on the price. The signal line is just a smoothed version of the MACD line i.e. it’s a moving average of the MACD line.
This is the important part! When the Signal Line and the MACD Line cross, this triggers an indicator that either the price may be above or below what it should be.
When the signal line cross from below the MACD line, this indicates that the price is higher than it will be and a sell decision is advisable.
When the signal line cross from above the MACD line, this indicates that the price is currently lower than it will be and a buy decision is advisable.
The MACD-Histogram is an easy way of interpreting these indicators. The MACD-histogram fluctuates around zero. When the bars go from negative (positive) to positive, a “Buy” (“Sell”) signal is triggered.
How Effective had the MCD been in Predicting Steem price.
Here we will look at the total graph with everything in it.
We are trying to determine whether implementing this strategy would have yielded a positive outcome relative to a position where we did nothing.
Over the period 1st Feb to 30th April, three signals were generated. With the benefit of hindsight, we can see if these were good signals. A good Buy signal will be one where the price increased following the point of the signal. A good Sell signal will be one where the price decreased following the point of the signal.
You will see the two buy signals were right on the money! Buying at these times would have produced very good returns for an investor. The one sell signal was neither good nor bad. The price change after the signal was such that the price went up marginally before the buy signal was triggered.
So, what I have seen so far is very interesting and would lead me to believe that using the MACD could be valuable for an investor or just as a tool to measure where the price is relative to where the MACD thinks it should be.
I have analysed the results for June and will post them shortly. The purpose of this article was to look at MACD in the context of the Steem Price and introduce people to the tool.
Thank you for reading.
Source of data: I produced these graphs in Excel using daily Steem prices from coinmarketcap.
That was a nice, easy read.
Good job and thanks for sharing, it helped even a trading noob such as myself 😀
I have to Thank you and For Real. NOt a Fake' Thanks, Now please Follow me comment.
Visuals are they Key or Portal for some folks to See exactly what they have been reading and trying to visualize.
Something just reached over and touched me on my shoulder as I was taking in all this great information and all the Sudden it CLICKED!!!!
I know exactly what I'm looking at now.. !!!!!
THANK you!! Your stuck with me now!!
I am interested in learning more trading techniques. This method looks very promising and has worked well for steem historically. I will be interested to see for it fairs in the coming months.
Great analysis resteemed.
great job thank you!
I'd like to include a link to this in our next math compilation in a few days. Would that be OK? Especially as you don't use any math tags.
Thanks
!-=o0o=-!
To follow curated math content follow @math-trail.
If you wish @math-trail to follow you then read this article.
Click here for Mathematics forum on chainBB
Yeah, That would be great. Thanks
Excellent analysis I've followed you. How How one go about producing their own MACD analysis?
Very detailed post on MACD! Can you make a post on the MFI indicator?
Great info.Thanks for sharing.
Wow! Good work thats too much yime to do you are great man! This can help me soon when I will earn great value. Keep it up Sir @bitgeek 🤗
Excellent post - Thanks for sharing