Updating my thoughts 💭
Allow me to "update a few of my thoughts"
From yesterday's post's comments section
Updating my thoughts 💭
This post has reference to my two most recent posts:
I still don't have a definitive answer on that breakout (is it a real breakout or not?), but I do have a few more thoughts on it and BTC in general. Today I will share those.
My TradingView charts
When I started using TradingView I favoured using the USD/BTC trading pair from Bitstamp. I like Bitstamp because its history on TradingView goes back far further than most, right back to the early days of BTC in August of 2011. The longer history gives more TA options and allows for better analysis when using things like trendlines, long term averages or Fib levels.
But after a while I noticed regular discrepancies between BTC price on Bitstamp and the average price on CMC. To remedy this, I switched to using Bitfinex because it had a far greater daily volume. Prices on Bitfinex are normally close to the CMC average price, so I kept using them, jumping to Bitstamp occasionally when necessary.
But the recent Bitfinex/Tether issue threw Bitfinex prices out, I should not have used Bitfinex BTC price for this post, but I wasn't paying attention to the price anomaly on the exchange and I used it anyway.
Subsequent to that, when writing yesterday's post, I found the price of Bitstamp to be more reliable. I also found that Coinbase charts were very similar to Bitstamp ones. These were both charts feature in yesterday's post and did not indicate a proper BTC breakout in that post.
More charts
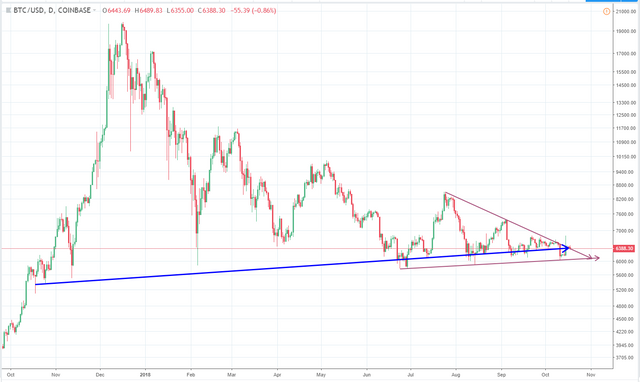
Investigating further, I found that Coinbase normally has a higher BTC volume (with USD) than what Bitstamp does. So today I am using (mostly) Coinbase charts for the first time. Let us see what they want to tell us today:
The first chart is a Coinbase log chart. It is almost too close to call when looking at that chart (did BTC breakout or not?).
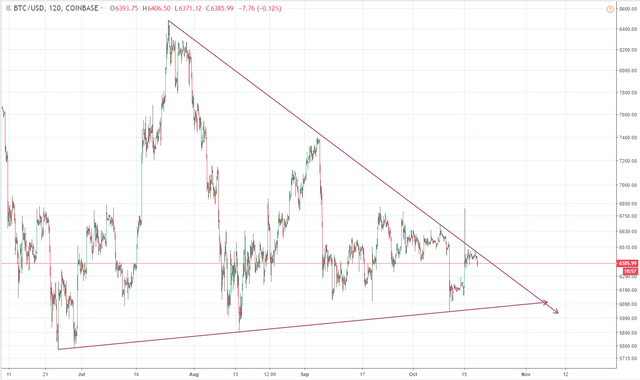
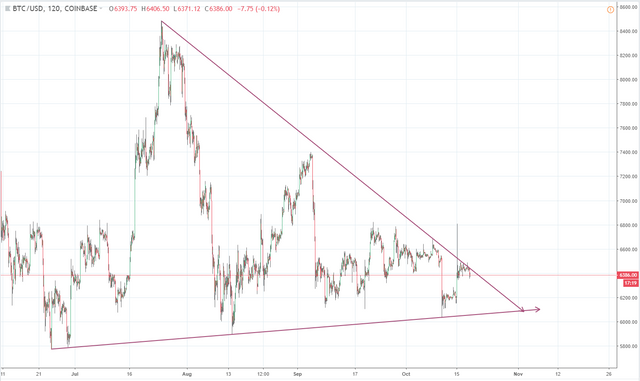
This is the linear version of the same chart. It shows the same thing as the log chart: indecision.
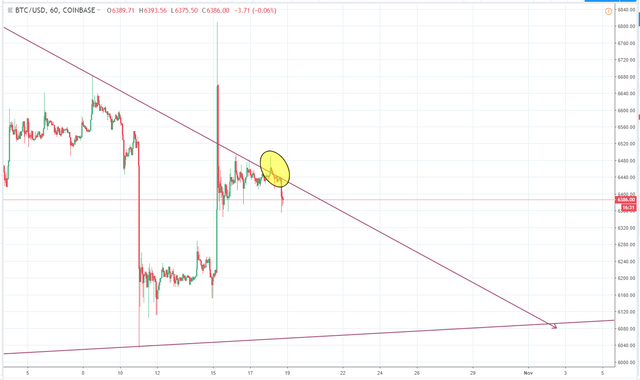
But zooming in a bit and using a one hour chart does indicate a possible breakout, but definitely not a strong one. Under different circumstances, I would not really entertain that as a breakout at all. It's only in light of yesterday's post and the issues which it highlights, that this little bump on the curve becomes important.
So there is still nothing definitive in this regard, we may have to wait another day or two, but honestly it doesn't matter that much. I have already said that we are in the early stages of a bull market. I stand by that. In fact: I see new examples of what I spoke about in this post every day! https://mentormarket.io/cryptocurrency/@bitbrain/one-month-into-the-bull-market A lot of cryptos are now behaving bullishly! Who cares if BTC is late to the party?
Besides, no matter what the prophets of doom say, last year on today's date BTC was trading in the mid $5300s region (hard to see the exact price, there was huge price variation on 18 October 2017). That is still a year on year increase of almost 20%, far better than many traditional investment options. See the chart below:
In addition to this the precious 200 Day Moving Average has just flattened out. In other words, it has stopped dropping. This is an indication of a market turn.
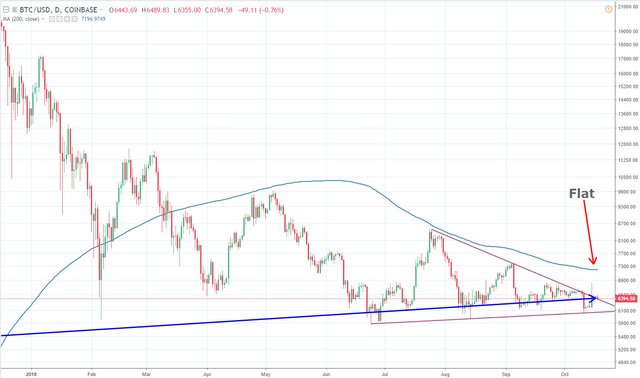
Note: I am dead against using rules like "it is so because the 200 Day MA says so". That is utter rubbish. The fact that 200 is a large round number does not give it some magical value and make it better than, for instance, a 197 day MA or a 276 day MA. But historically it is a fairly reliable indicator. Just remember that TA is a tool, not a rule! (Hey, that's brilliant. I hereby make that "Bitbrain's Sixth Law of crypto". Perhaps I should do a post recapping my laws soon...).
Having said that about the 200 MA, there is an indicator which I really like: The Stochiastic indicator with K set to 50. Normally I would use it with Day candles, but because of the length of this time period, I'm using it here with Week candles. Notice that this is a Bitstamp chart so that I can go back far into history.
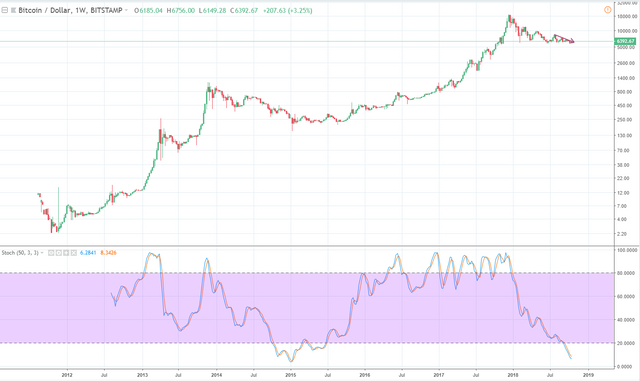
My custom Stoch shows us some important information:
BTC is almost in the most oversold state (long-term) that it has ever been!
- Analysis: BTC has a huge bull run ahead of it.
The Stoch indicator is turning right now
- Analysis: the market is turning bullish right now!
Conclusion
So do not fear Bit Brainians about whether BTC has just broken out properly or not. Long-term analysis shows us that we are in for a massive race upwards. Also, I don't think TA can take into account all of the factors here: I foresee a lot more money entering the market than before, much, much more. Without sounding like an excited child or a random internet looney, I think this rise could even surpass some of the most bullish projections out there today. I attribute this to what I am calling "Institutional FOMO". Just you wait and see 😉
I may not know exactly what BTC is doing right now, but I do know what is coming!
Yours in crypto,
Bit Brain
All charts made by Bit Brain with TradingView

Bit Brain recommends:
Crypto Exchanges:


Published on

by Bit Brain

Thanks for the continued and additional perspective! I think the tides are turning as well hopefully sooner rather than later.
Holding thumbs. (And teeny tiny bags of many altcoins)
Great post @bitbrain
I was always taught to use the chart that represents the market with the most daily volume to do my TA which would be Bitmex that has similar price to Bitstamp so yeah I agree with you.
I completely agree, I would even say MAs have no predicting power at all because they all lag behind the market which makes them look great in hindsight but are completely useless for trading, just look at CoinDesk's "expert trader" who's a great fan of MA, the dude has been consistently wrong in his analysis it's embarrassing.
Love the RSI though, divergences are great trading indicators.
Some very good points there, thank you!
I could never find BitMEX on TradingView and I never thought anything of it, until I just read your comment... Then I thought it should be there and that prompted be to remember that BitMEX doesn't use the abbreviation "BTC". Thanks to your comment I now have the BitMEX XBTUSD chart first in my TradingView queue, and I look forward to using it in the future!
MAs are way over-used, especially when people read a MACD and read way too much into a crossover. The next person who says "Death Cross" in front of me is going to get a right hook to the jaw! And I completely agree with your reasoning, they are trailing indicators, some of the worst railing indicators out there. By definition, the longer the integration/averaging period of the MA, the more it relies on historical data i.e. the more it trails. And as for "experts" in the crypto field : my feelings on such bogus charlatans are well documented: https://steemit.com/cryptocurrency/@bitbrain/crypto-experts
RSI IS a great indicator and I love it too. RSI, Stoch and sometimes Bollinger Bands (which may require more interpretation than the other two) are the closest things I can find to a proper leading indicators and I enjoy using them (though I seldom publish that, I prefer to keep my posts fairly simple and not packed with indicators and drawing tools).
It took me a while to learn how to use the RSI and Stoch properly, the trickiest bit was figuring out which one to use when. By using many historical examples and by pulling the formulae apart, I eventually realised that Stoch is the best indicator for USD traded pairs (like BTC normally is) and RSI is the best for coins traded in another crypto (like BTC or ETH). I think this is because Stoch and its highs and lows based formula better accounts for the volatility of crypto price swings, whereas RSI and its averages based formula works better for the more stable fiat currency base pairs. I think that the StochRSI is the biggest waste of time and bring nothing to the table. It is less accurate than either the Stoch or RSi because it is a derivative indicator of a derivative indicator. I never use it. Like most TA, Sotch and RSI work best over long periods, and for that I find setting the "K" value of a Stoch indicator to "50" to be invaluable and unbeatable in terms of prediction accuracy. Unfortunately setting the "length" of an RSI to "50" is not nearly as useful.
That’s a good statement, “TA is a tool and not a rule” ... I have repeatedly tell that to many non TA believers in the past...
Good post @bitbrain
Posted using Partiko iOS
Thanks man!
Post the rules! Post the rules!
Posted using Partiko Android
Alrighty then...
I only recently found you but from what I've seen your TA is more appealing than most.
Posted using Partiko Android
Thanks. I make a concerted effort not to be "like most".
Ahh a true contrarian, most beautiful. Lol
Posted using Partiko Android
Ha ha! I think of myself more of a value investor in terms of how and where I put my money. But yes, my viewpoints are rather contrarian in nature.