Steemit Crypto Academy | Season 4 Week 6: In-depth Study of Market Maker Concept for professor @reddileep

Question 1
Define the concept of Market Making in your own words.
Market making is a phenomenon in the crypto market where a user or group of users on the market create their own bid and ask prices for a particular asset, disregarding the current bid and ask prices on the market.
This process is key in providing liquidity to market in most instances. For example if the bid-ask spread difference (difference between the ask price and bid price)of a cryptocurrency is large on the market, a market maker can adjust his Bid-price to a slightly higher value if he is buying or slightly lower his ask price if he is selling.
This reduces the Spread difference and orders are executed very quickly since the spread is low.
High Bid-Ask spread normally results in a low liquidity market, where orders take a lot of time to execute.
Market makers also influence the price of cryptocurrencies on the market. They do so by creating their own Bid and Ask prices for a cryptocurrency.
Most traders would now use their stated Bid and Ask price as their range to set up their own Bid and Ask prices. For example; a market maker can set his Bid price for 1 BTCat $55,000 and his Ask for $56,000.
Most traders taking this Bid and Ask prices into consideration would now set their Bid-price to let’s say $54,500 and their Ask prices to $55,500 to increase the liquidity of the market.
With this method also market makers stabilize the price of the cryptocurrency and prevent it from going overboard/ wayward.
Question 2
Explain the psychology behind Market Maker. (Screenshot Required)
The main psychology behind market making is to provide the cryptocurrency market with constant liquidity.
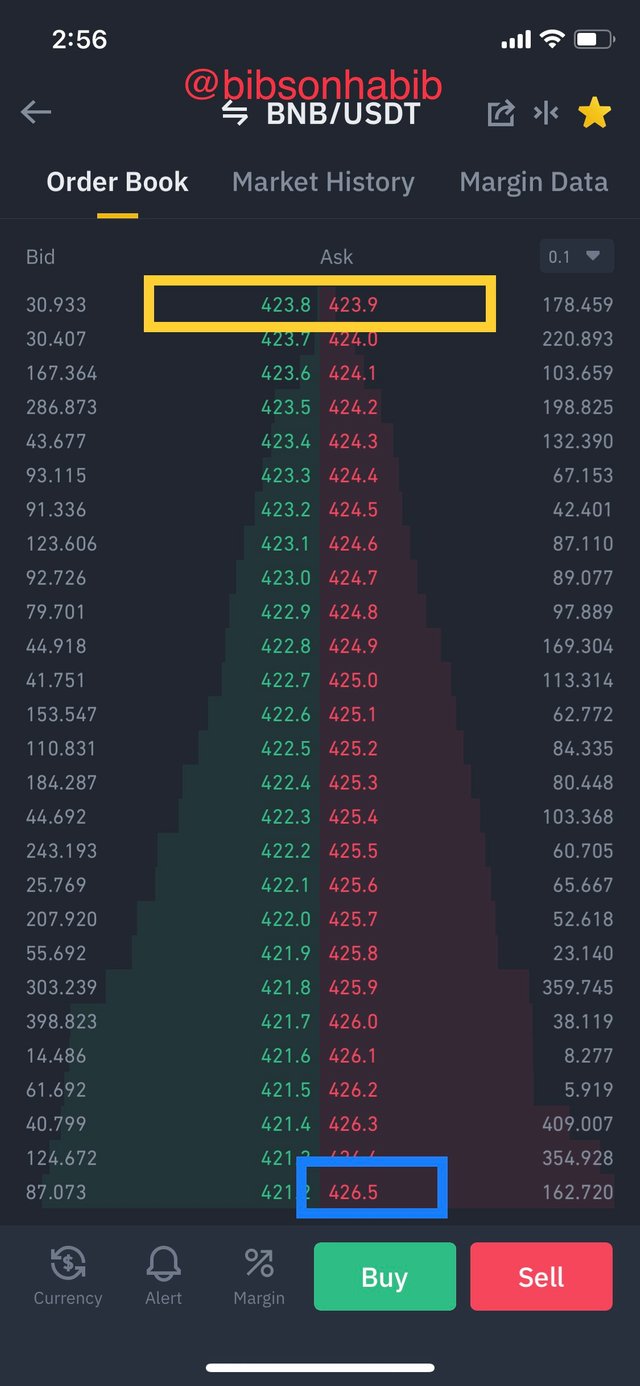
Taking a look at the order book below of the BNB/USDT pair, we can see that the market makers have provided a series of Bid and Ask prices with the highest Bid-Ask price at the Lowest Ask- price at the top.
We can also see that the Bid price decrease and Ask prices increases we move down the order book. We can also see that the Bid prices are slightly lower than the Ask prices.
The market makers ensure that the Bid-Ask spread difference is very small for all the listed prices in order to make liquidity of the market very high.
This is why the highest Bid-price and the lowest Ask-price is placed at the top to provide a very low spread difference make liquidity greater on the market.
A high Spread would result in a large amount of time needed to complete orders and depending on the extent of the Spread difference, some orders may not complete.
For example if the ask price of 1BTC is set to $50,000 and a Bid price of $40,000 is placed on that order, the order may take a long time to execute due to the huge Spread of $10,000. If the market is in an uptrend, the order may never execute as the Ask-price would keep getting higher.
Also the different Bid and Ask prices set up by the market makers enable easy and profitable trading. With regards to our screenshot, we can see that we have a lowest Ask-price of 1 BNB for $423.9 and a highest ask of $426.5.
Hence a buyer on the market at $423.9 which is the lowest Ask price and Sell at any of the higher ask-prices he will, depending on the amount or percentage he wants to make in profit.
Question 3
Explain the benefits of Market Maker Concept?
Advantages of the Market Maker Concept
Provide Liquidity
Market makers creating a series of different Bid and Ask prices, with the highest Bid price and Lowest ask prices at the top, creates a very low Bid-Ask spread difference which makes the executing of orders very fast, thereby accounting for liquidity.
Determine Market Trend
Prices of assets set by market makers can be used to determine the current trend the market; whether prices are in a downtrend or uptrend.
If we notice Bid-Ask prices on the market tend to escalate higher, we can deduce that the price of the cryptocurrency is increasing, hence an uptrend and if the Bid-Ask prices are gradually reducing means that a downtrend is very likely.
This provides traders with key information/ signals on when to enter and exit the market.
Stability of the asset price
The Bid-Ask prices set by market makers serve as a range for which other traders use to set their own prices, hence prices of trades fall within and dow not exceed this range. Making prices of assets very stable.
Increase the price of a cryptocurrency
Since market makers determine the price of an asset, they can choose to increase the Bid and Ask price of a cryptocurrency, causing its value to increase. This increase in price also attracts a number of investors to buy the cryptocurrency, increasing the number of holders of that particular cryptocurrency.
Question 4
Explain the disadvantages of Market Maker Concept?
Manipulation of prices of assets in their favor.
Since market makers determine the price of an asset, they can choose to initiate a large sell order on the market, forcing prices to decrease.
They then initiate a huge buy order during the dip and buy at a very low price, forcing prices back to normal. These phenomenon eliminates low volume traders since they round up in great losses due to this intentional manipulations.
Lack of Transparency
Also there is lack of transparency in the market maker concept. Market makers decide their Bid and Ask prices without any consultation of other traders.
Traders have to work or trade with the prices the market makers present. The entire process therefore lacks transparency since some users are not involved in the Bid-Ask pricing process.
Slippage
Slippage is also common in the market maker concept. Slippage is a phenomenon on the cryptocurrency market where an order is filled at higher or lower price than the price intended by a trader when placing the order.
Due to the constant volatility in the cryptocurrency market, market makers continue to change the Bid and Ask prices. This can result to an order being filled at a higher price. For example on the steemit market, the current SBD to STEEM to conversion rate is 1 SBD to 11.918 STEEM, an order for the 11.918 STEEM can result in a completed order of 10 STEEM or less.
This is because the price of 1 STEEM can increase by the time the he order is filled, compelling the expected price at the end of the order to reduce.
Conflict of Interest
Conflict of interest in order completion is also a major disadvantage of the market maker concept. Traders are therefore eager about the completion of their orders and don’t care what happens to the orders of other traders. Traders tend to trade against each other in order for their orders to be completed on the market.
Does not support Scalp Trading
The market maker concept does not support scalp trading. Scalp trading is a trading method where investors seek to make profits off their asset given small changes or increment in the price of the asset. The investor then re-sells the asset to make a profit off the small change in price of the asset.
For example if a trader holds 1 BTC which is equivalent to $50,000 and bitcoin prices suddenly increase to $51,000, the scalp trader sells off his 1 BTC to realize a profit of $1,000.
The Market maker concept hinders scalp trading due to its low Bid-Ask spread difference, giving scalp traders very little in profits should they decide to sell. This meager profits tend to discourage scalp trading in the market maker concept.
Question 5
Explain any two indicators that are used in the Market Maker Concept and explore them through charts. (Screenshot Required)
In this regard, I would be using the Average directional Index (ADX with +D and -D) and also the Relative Strength Index (RSI) indicator.
Average Directional Index ( ADX with +D and -D)
This is a type of technical indicator used to determine the strength of a trend on the market. The ADX with +D and -D indicator is made of three lines namely the ADX line, +D and the -D line.
The Average directional Index line consist of an oscillating trend line with a scale of values from 0-100 which is used to determine the strength of a trend.
The +D line is the positive indicator line is used to determine the direction of a market trend in the positive or uptrend direction.
The –D line is also used to determine a market trend direction in the negative direction or downtrend.
The ADX line has an interpretation for its values for 0-100.
Below is the interpretation of the ADX values
| Value | Meaning |
|---|---|
| 0-25 | Very weak trend formation |
| 25-50 | Strong trend formation |
| 50-75 | Very strong trend formation |
| 75-100 | Extremely strong trend formation |
Since ADX values shows weak trend when values are lower than 25 and strong trends when values are higher, the +D and –D trend lines are used by traders to determine trading signals.
When a crossover occurs between the +D and the –D trend lines and the ADX value is 25 or greater, then it is good buy signal for the trader sine the trend in the market is strong.
Also, if a crossover occurs and the ADX is less than 25, that means a downtrend is apparent and a good time to exit the market. Traders should therefore sell off and exit the market.
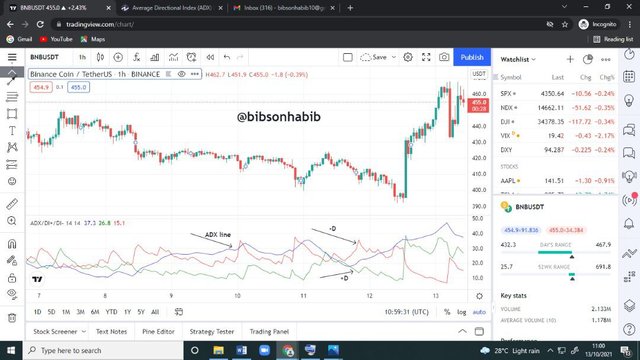
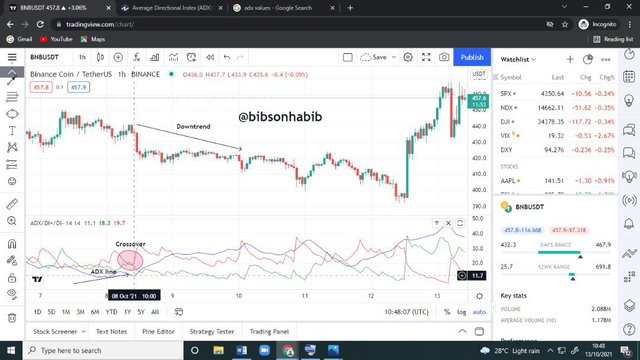
Let’s take a look at this screenshot
Taking a look at the screenshot, we can see that at the time of crossover between the +D and –D lines, the ADX value was 36.3. This signals a strong trend.
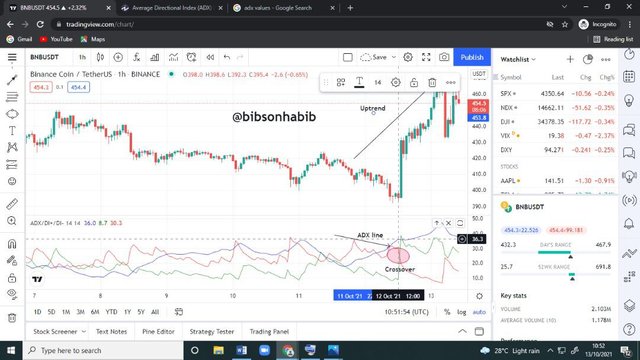
Taking a look at the BNB/USDT chart after this happening, we see that the price of BNB starts to increase afterwards. Hence if a trader makes good use of the signal the ADX indicator gave out, he would be in profits
We can also see that from the screenshot below that another cross over occurred but the ADX value was 11.7, signalling a weak trend. We saw prices surge afterwards.
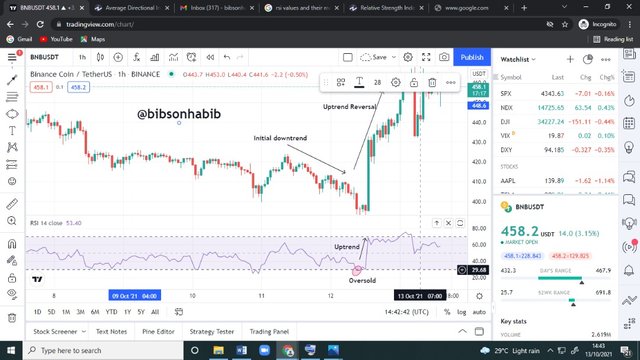
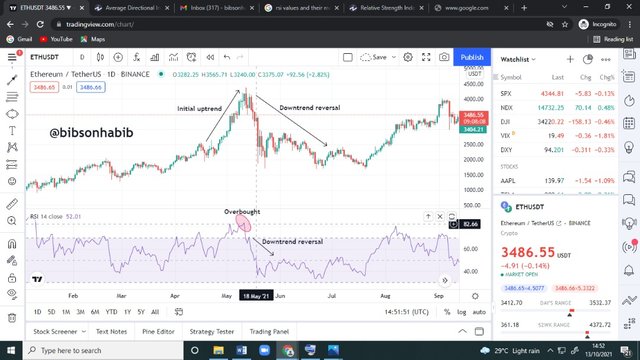
Relative Strength Index
Just like the Average Directional Index (ADX), the RSI is another type of a technical momentum indicator used to determine overbought and oversold market signals on the market.
It is made up just one trend line which moves higher or lower depending on the current market trend. The RSI indicator is made up of values ranging from 0-100.
0-30 on the RSI indicator means an asset is oversold, meaning a market uptrend is very much likely whiles a 70 and above mark on the indicator signals that an asset is overbought, meaning a possible market downtrend is apparent. I would explain why this is so in the subsequent paragraphs.
This phenomenon give traders prior signals as to what the market trend would be.
An RSI value of 30 or less means that an asset has been oversold and traders are exiting the market, forcing the price of the asset to reduce.
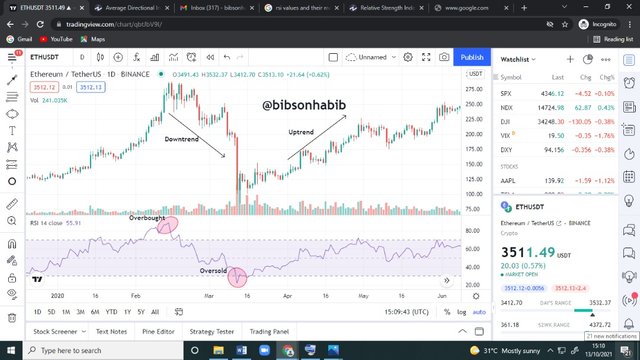
However, an uptrend reversal occurs just after the oversold signal since new traders would enter the market at the time of the asset’s dip and buy the asset, forcing the price of the asset to go high. From the screenshot below, we can see that the RSI value at the peak of the oversold was 29.68, thereby indicating a possible uptrend.
Also an RSI value of 70 and above shows that the asset has been overbought, meaning that more traders are entering the market, forcing the price of the asset to increase initially. A downtrend reversal occurs just after the overbought signal since most traders would exit the market when the asset reaches its resistance level after they have made profits.
The asset price then reduces due to the selling pressure, since the supply of the asset would now be higher than its demand on the market.
From the screenshot, we can see that the RSI value at the peak of the overbought signal was 82.66, signalling a very apparent downtrend, which occurred very quickly.

Conclusion
In conclusion, the activities of market makers are very crucial to the well being of the crypto marketplace as they provide liquidity which is the key component of any marketplace. Technical indicators can also be useful to investors in determine assets prices in order to know when to enter and exit the markets.
Much thanks to professor @reddileep for this educative assignment. Looking forward to joining his next class. Warm regards to all professors and members of this wonderful community.
Thank you for your time.
Hello @bibsonhabib Thank you for participating in Steemit Crypto Academy season 4 week 6.