Steemit Crypto Academy| Season 3 Week 5: Trading With A/D indicator by @bibsonhabib

Question 1
Explain in your own words what the A/D Indicator is and how and why it relates to volume. (Screenshots needed).
As its name suggest Accumulation is the gathering or acquiring of useful cyptocurrency assets with the intention of holding it for the long term.
Distribution in cryptocurrency terms is or selling out of cryptocurrency assets either to make profits or to cut or minimize losses.
Hence an Accumulation/ Distribution Indicator (A/D) indicator is a type of indicator which uses the price and volume if a cryptocurrency asset to determine whether the cryptocurrency is in accumulation or distribution phase i.e whether the cryptocurrency currently is been held or sold out.
This provides very accurate information on the nature of the market; whether it is experiencing an uptrend or downtrend to enable traders act upon these signals in order to gain profits or minimize their losses.
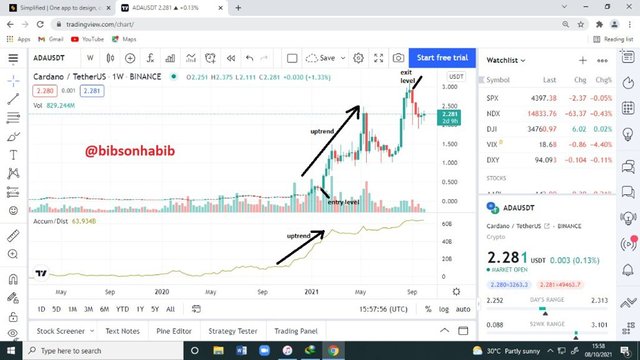
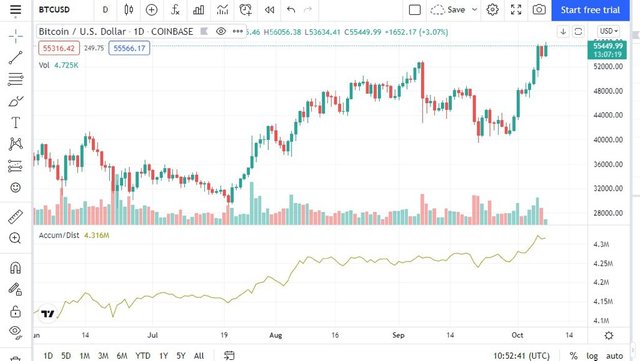
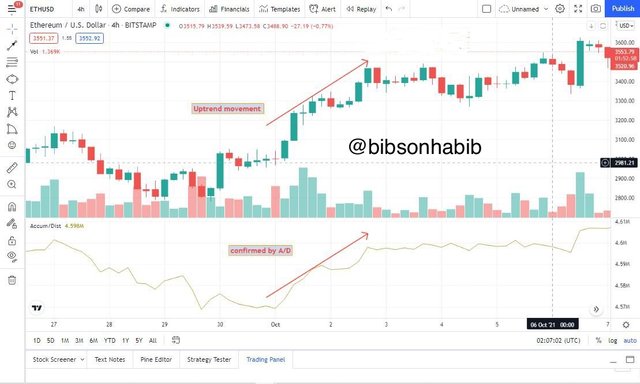
A/D indicator showing uptrend
The A/D indicator consists of line which is always in constant motion along the price charts which determines the Accumulation/Distribution index by multiplying the closing price of the cryptocurrency by its current volume on the market.
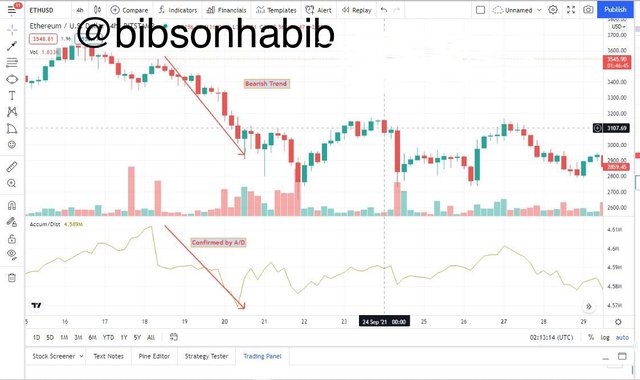
Hence the rising of the A/D indicator line would indicate a market or price uptrend and the fall of this line would indicate a downtrend.
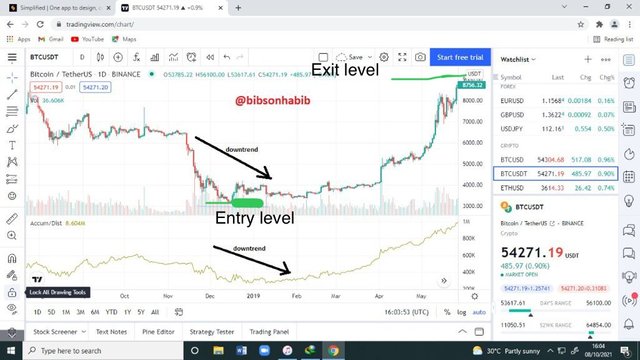
A/D indicator showing downtrend
This also help us interpret the current state of the cryptocurrency on the market, taking the cryptocurrency’s opening and closing price into consideration and also its volume on the market; we can determine from the multiplying of these two parameters whether there is buying pressure or selling pressure.
If there is an increase in price of a the cryptocurrency, whiles the A/D indicator line is falling, it shows that the trader are exiting the market, hence a selling pressure; therefore a surge in the price of the cryptocurrency is apparent.
Also if the price of the asset is low whiles the indicator line is rising, it shows that there is a buying or accumulation pressure, hence a price uptrend is very near.
The A/D indicator relates to volume in a sense that it operates on the basis of Demand and Supply. When there is increased demand of a cryptocurrency, it causes the price to increase. Trading begins between the two parties i.e buyers and seller. The buyers have the asset supplied to them at the stipulated market price.
In the process new volumes or generated and supplied to the buyers; This accounts for the volumes.
Also if there is a Low demand for the cryptocurrency, the price of the cryptocurrency falls creating a selling pressure in which huge volumes are exchanged or distributed into the market. Why the A/D indicator relates to volume is that the higher the volume, the higher the final value of the A/D indicator.
Volume is also very key in calculations of the A/D indicator. Volume is also used to determine the divergence between the cryptocurrency's demand and supply, since it operates on this basis.
Question 2
Through some platforms, show the process of how to place the A/D Indicator (Screenshots needed).
In this regard, the platform I would be using is tradingview
- I searched tradingview in the google search box. I clicked on tradingview.com.
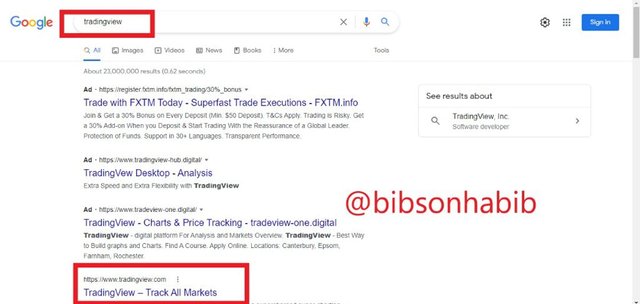
- On the homepage, I clicked on charts

- A page displayed, I clicked on indicators and strategies.
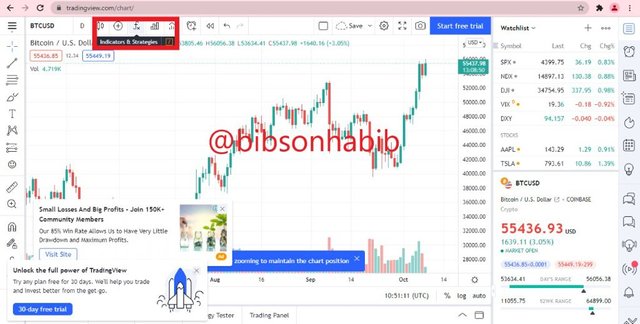
- A dialog box appeared, I searched accumulation and clicked on Accumulation/ Distribution
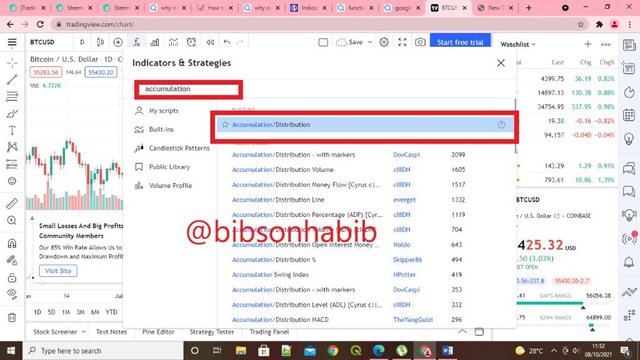
- The indicator was added successfully
Question 3
Explain through an example the formula of the A/D Indicator. (Originality will be taken into account).
To successfully calculate the Accumulatiom/Distribution indicator, we would need three parameters namely; Money Flow Multiplier (MFM), Money Flow Volume (MFV) and Accumalation/Distribution line (ADL).
To obtain these parameters, below are their Formulars
To obtain these parameters, below are their Formulars
Money Flow Multiplier (MFM)
The formula for MFM is the difference of the Closing price and Its Lowest price minus the difference of its High and Closing price, dived by the difference of its Highest and Lowest price.
That is
MFM= (Closing Price - Lowest Price) - (Highest Price - Closing Price)/ (Highest Price - Lowest Price)
Money Flow Volume (MFV)
Money Flow Volume is the value of the Money Flow Multiplier, multiplied by the Volume of period.
That is
MFV= MFM * Volume of the particular period
Accumulation/Distribution Line (ADL)
The formula for AL is the sum pf the Previous ADL and the current Money Flow volume. That is
ADL= Previous ADL + Current Money Flow Volume (MFV)
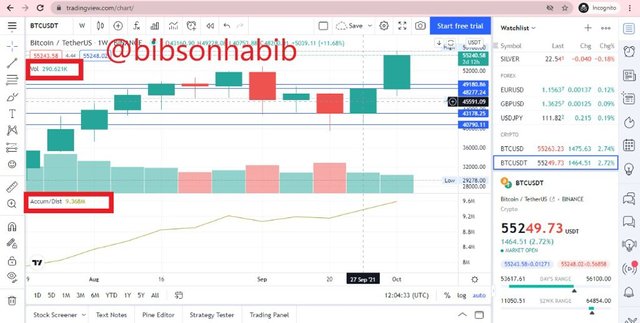
Lets consider the chart below;
In the BTC/USDT chart above, we have the following parameters.
Highest price = $49,180.8
Closing price = $48,277.24
Lowest price = $43,178.25
Period Volume = $290,621
Previous A/D = $9.368 Million
Lets calculate for the parameters
MFM= (Closing Price - Lowest Price) - (Highest Price - Closing Price)/ (Highest Price - Lowest price)
= (48,277.24 -43,178.25) - (49,180.86 - 48,277.24)/ (49,180.86 - 43,178.25)
= (5098.99) - (903.62) / (6002.61)
= (4,125.37) / (6002.61)
= 0.6989
=*** 0.70 (2 s.f)***
MFV= MFM * Volume of the particular period
= 0.70 * 290,621
= $203,434.7
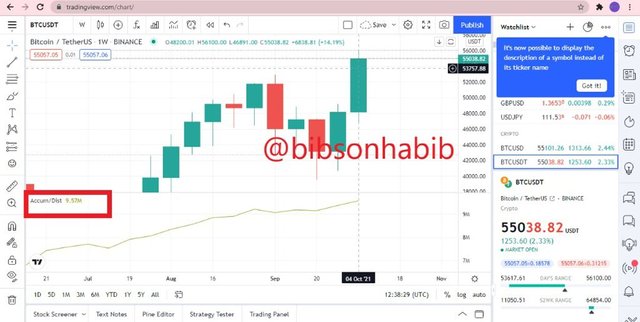
ADL value = Previous ADL + Current Money Flow Volume (MFV)
= $9,368,0000 + $203,434.7
= $9,571,434.7
This corresponds to the current ADL value.
Question 4
How is it possible to detect and confirm a trend through the A/D indicator? (Screenshots needed)
Every indicator always has a specific role they play in a trader’s life or activities. Now, indicators are always capable of telling the trader if the chart he or she is dealing with whether it is in the bull season or the bear season, which we can referred to it as downtrend and then an uptrend which I will be delving into detail.
Another thing that may also occur is a sideway movement of the trend which can also be shown by the indicator.
Bullish Trend
For bullish trend, it means that the price of the asset is always going up. Meaning traders are always holding their assts for it to reacha certain limit and when its about dropping they sell. But our key interest is not there.
Our interest is based on the fact that, when the price of the asset is rising, we see the A/D indicator also moving up. This indicates that traders have accumulated their assets for a long-term basis. At this point the trader has no intentions of selling his or her assets.
BearishTrend
Now talking about a bearish trend, we can also call it a downtrend in trading. Now when using the A/D indicator, we will notice when we having a bearish trend, thus we would see that the assets fall down. As in the case of the Bullish where the assets were moving up, here it goes down which indicates that it’s a distribution as used by the indicator.
This also signifies that, it’s a sell season. At this point, majority of the traders would like to release or sell their assets as they might turn out to lose if they do not sell it. Let’s confirm this on a chart.
Question 5
Through a DEMO account, perform one trading operation (BUY or SELL) using the A/D Indicator only. (Screenshots needed).
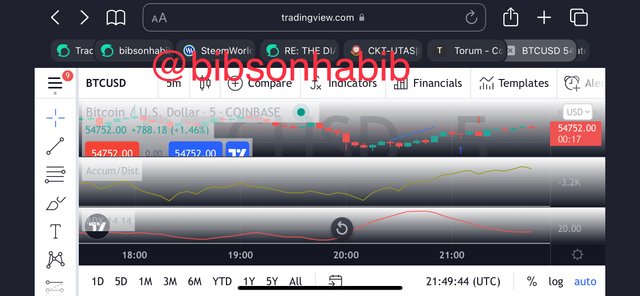
In this regard, I would be using BTC/USD pair. In the 5 minute chard of the BTC/USD pair, we will notice that prices where in th downtrend or reducing.
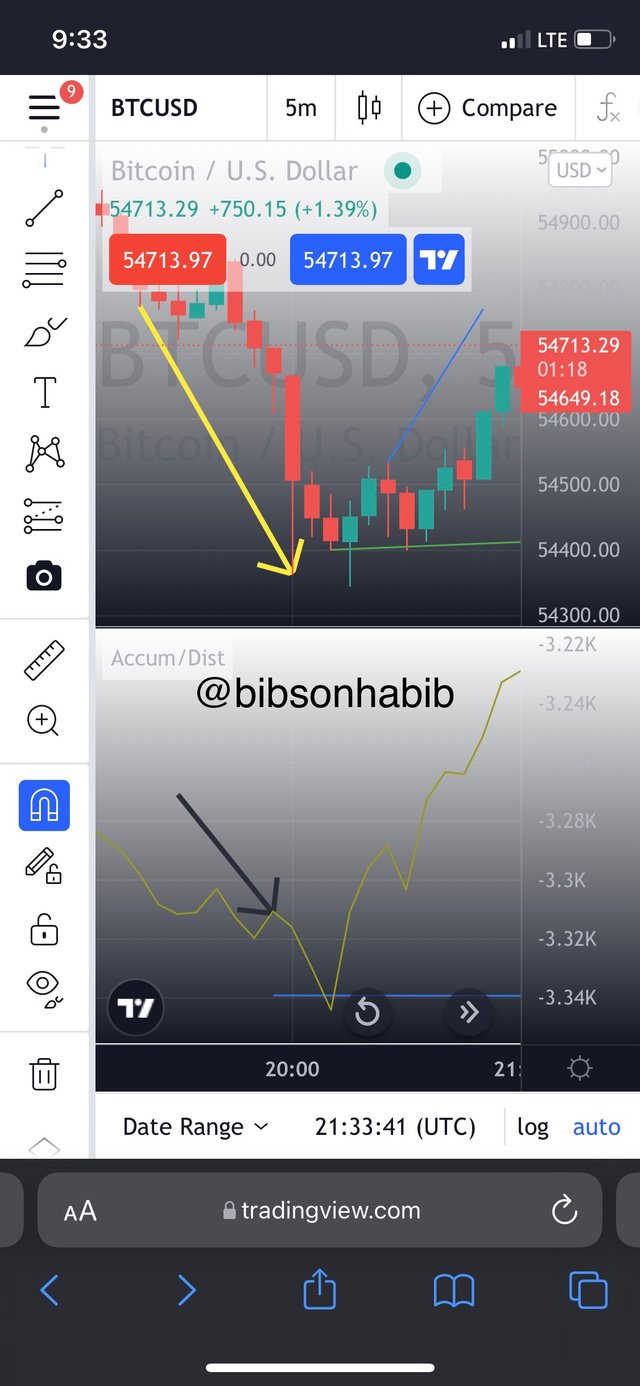
Within the twinkling of an eye, we noticed that price had reached resistance level and both the price chart and the A/D indicator were showing a possible uptrend which is very visible from the graph.
The divergence between the A/D indicator movement and price was very low as they were all moving in the same direction. We can see prices appreciating afterwards.We can see from the blue trend line in the A/D indicator that the bears had lost control and supply was broken and the market was now in the accumulation phase.
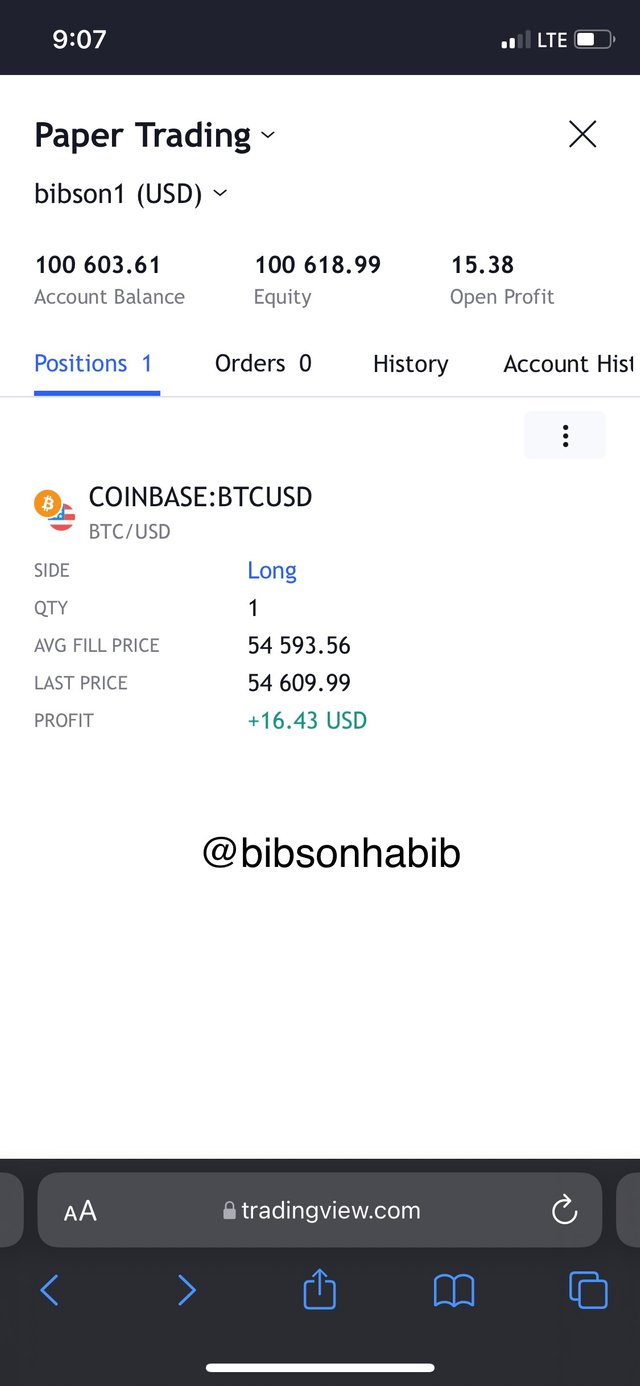
I therefore took the buy position on the market and placed an order on 1BTC.
I filled the other at a price of $54,593.56, within some few seconds prices swang to $54,609.99 making me a profit of $16.43.
Question 6
What other indicator can be used in conjunction with the A/D Indicator. Justify, explain and test. (Screenshots needed).
In this regard, I would be using the average directional index (ADX) indicator. The ADX indicator has a range of values from 0-100.
0-25 means a weak trend. 25-50 means strong trend. 50-75 means a very strong uptrend and 75-100 means an extremely strong uptrend.
From the screenshot, we can see that when the prices of BTC was surging, we had an ADX value of less than 20 which shows that the trend was weak, hence prices were in a downtrend.
Moving forward to when prices started to increase, we can see that the ADX value surpassed the 20 mark and reached a value of 30 indicating a strong trend. The trend lines of the A/D is in agreement with this.
Since indicators are however not 100% correct, Both indicators are also fallible in some instances and caution should be taking when using them together.
One indicator can show a strong uptrend whiles the other sites it as a weak trend. Traders should therefore devise means to interpret these happenings should they come across it.
Conclusion
The A/D indicator which I didn’t know prior to writing this assignment is also very useful in technical analysis as it interprets information that are not common to ordinary indicators.
It also provides prior information on the state of the market before trend. Hence traders who use this indicator are able to enter the market, if the signal from the indicator is good or exit if the signals are bad in order to make huge profits or miniseries/ cut their losses if there is the need. I would therefore urge traders to explore more and try this indicator sometime.
This has been a very educative assignment by professor @allbert. Looking forward to joining your next class. My warm regards to all professors and members of this wonderful community.
Thank you for your time.