Steemit Crypto Academy | Season 3: Week 7 || How to create an account on TradingView, how to use indicators,tools, features of tradingview
1.- Defining the TradingView site and how to register an account in trading view? what are the different registration plans?(screenshot necessary)Trading View is a website where we can connect with other traders and investors from all around the world. Through this website, we can find opportunities in markets all around the world, and on this website, we can see the chart of the best assets in the world and we can use best the tools in the world.
This website has a lot of features we can use different indicators from different types of trading points of view so that we can check the market for trending coins or any asset. And there are many more features that we will talk about later in this homework 🙂.
In the trading view unlike some other trading charting platforms that may provide chats of only crypto example is Binance kucoin, or maybe MetaTrader for only forex charts, the trading view combines all Market and even include stocks market. so on the trading view, we can put chat on: crypto, futures, stocks, CFD, index, forex, in fact, every type of market you want is in the trading view.
Trading view also gives multiple screen options which gives the user precise and best results while using their preferred indicators on their preferred chat. In it includes the Stock screener, Forex Screener, and the Crypto screener, which makes it more concise to use whenever we want to trade based on our profits choice of market. The community is an interactive place where users can get the latest information about experts and other traders are given their opinion so far in the current market.
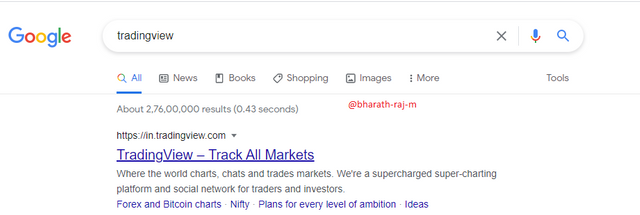
how to register an account in tradingview?- register an account on trading view is very simple if you follow the right steps, here I will explain and show it in clear terms, the first thing you need do is to visit your google and search for trading view on the search option
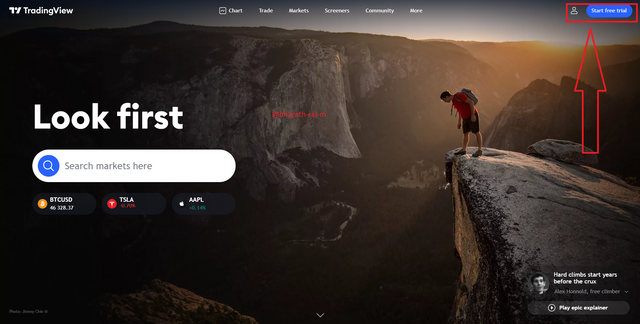
- Click the Start a free trial at the top-right of the page.
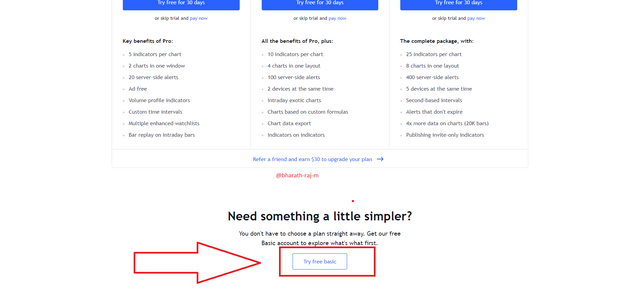
- On the next page, scroll down till down unite you and Try free basic selecting the Try free basic button to open a free account.
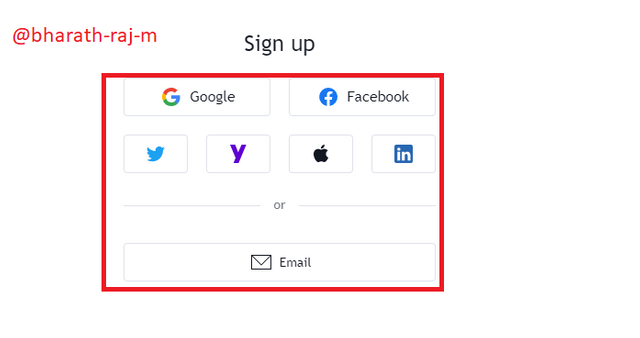
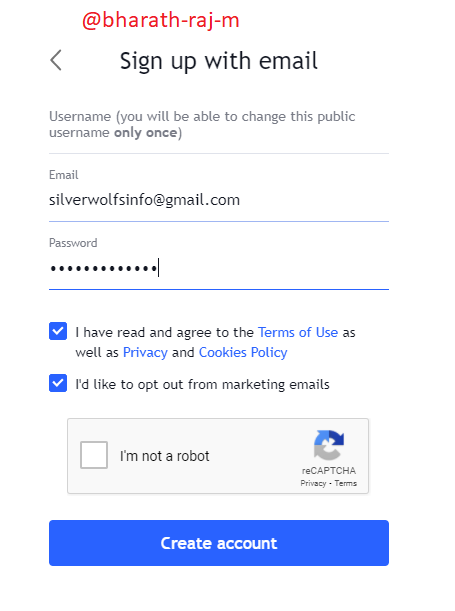
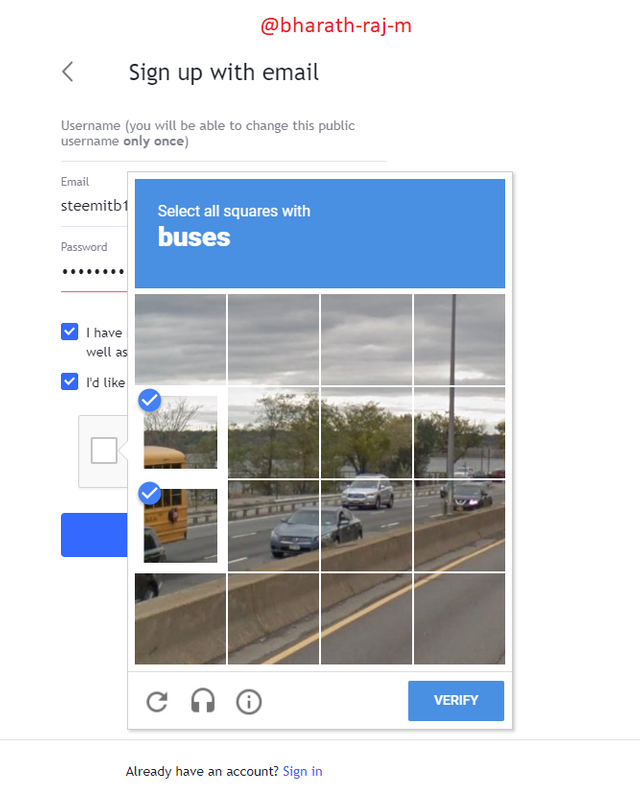
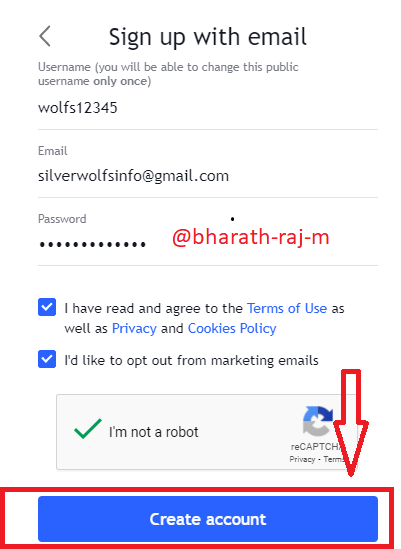
- On the next page, it will show you the mullite option to create an account like google, Gmail Facebook, Twitter, & more I am going to choose Gamil you can choose by your preference I inputted my Username, Email address, Preferred password, Agree to Terms of use and Privacy and Cookies Privacy then verified that I am not a robot and I clicked the Create account button.
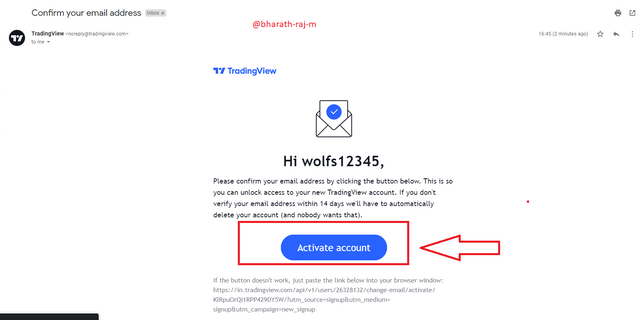
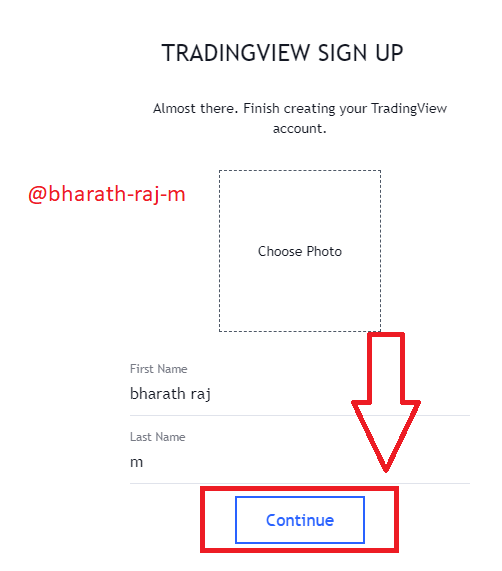
- An activation email was sent to my email inbox. Click on the Activate account button and on the next page, inputted your First and last name then click Continue. As shown on the screenshots below.
- Through all the steps above, we have been able to successfully registered for a free account on the TradingView.
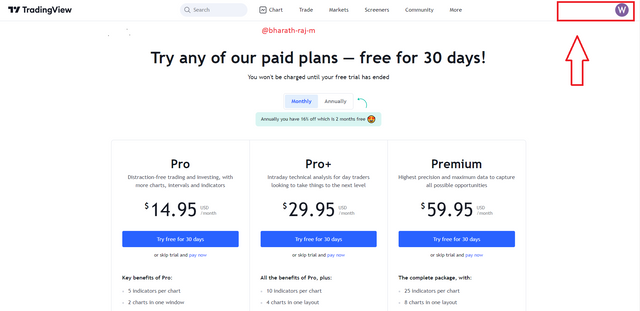
what are the different registration plans? (screenshot necessary)
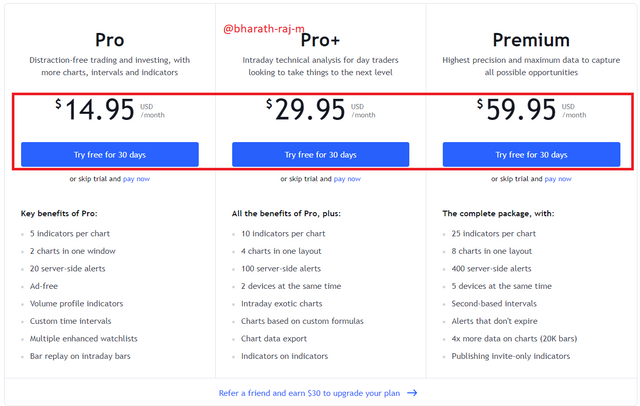
There are four different registration plans on TradingView, Free Basic, Pro, Pro+, and Premium. As we can see below screenshot.
All plants have different options if you upgrade to a more costly one we will get more options.
Pro plan this plan is basically for new comments in the trading system or people how to want to try it first, people who are just coming into the trading, this plan is specifically designated for new traders, people who want to specialize in technical analysis Explore this particular one but one occasion there is always one form of distraction or the other, regarding the nature of the chart. Some vital tools will be restricted thereby some new traders can't get access to it.
Key benefits of Pro
- 5 indicators per chart
- 2 charts in one window
- 20 server-side alerts
- Ad-free
- Volume profile indicators
- Custom time intervals
- Multiple enhanced watchlists
- Bar replay on intraday bars
source
pro+ 2nd plan this plan is for the intermedia trading people who have little idea on trading 💹, it's higher level than the pro plan, since traders here have an overview regarding charts and technical analysis they don't have any form of distractions, they just go on with their trades. In this case, some things are not all that limited at least they will have total access to alerts. But they can still be limited up to some options which they provide us in premium plan.
All the benefits of Pro+
- 10 indicators per chart
- 4 charts in one layout
- 100 server-side alerts
- 2 devices at the same time
- Intraday exotic charts
- Charts based on custom formulas
- Chart data export
- Indicators on indicators
source
Premium Plan 3rd plan and this plan is for pro traders and also It is the most complete and all the options described above are enhanced and some such as the display of graphs, the number of saved designs, alerts responses through webhook, and data time is infinite. The Premium plan is recommended for those who are dedicated to trading as a way of life and economic activity.
The complete package premium Plan
- 25 indicators per chart
- 8 charts in one layout
- 400 server-side alerts
- 5 devices at the same time
- Second-based intervals
- Alerts that don't expire
- 4x more data on charts (20K bars)
- Publishing invite-only indicators
source
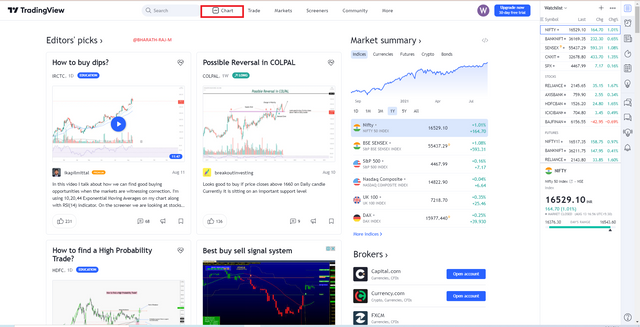
2.- Explain the different features of trading view and what is your favorite feature and why?(screenshot necessary)- the different features of trading view are officially found at the trading view homepage.

Chart TradeMarket Screener Community.
- 1.Chart
The chart won't be overemphasized here, as you all know it is basically where various of traders Carry out the different type of trading charts as far as the trading view is concerned, the chart has candle-stick, here traders will know the regulation of price in the volatile Market, it has many options at the left-hand side we have some important technical tools, at the right-hand side, we have the watch-tool and other important things too, at the top we have the indicators A chart is a useful tool for technical analysis tools that enable traders to see the price behaviour of an asset over time having the price represented in bars, lines, candlesticks, and so on. Different support and resistance in the market are seen on the chart and traders can take advantage of them for analysis, in addition to indicators, users to detect certain movements in an asset's market to decide entry or exit. TradingView chart below screenshot.
- 2.TradeMarket
The trade future have two options
- Top Broker
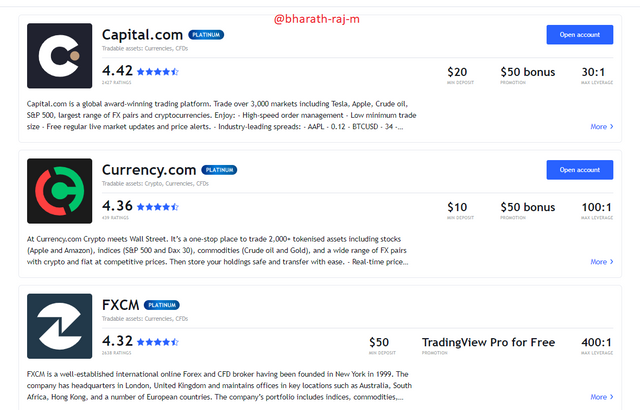
- Broker award
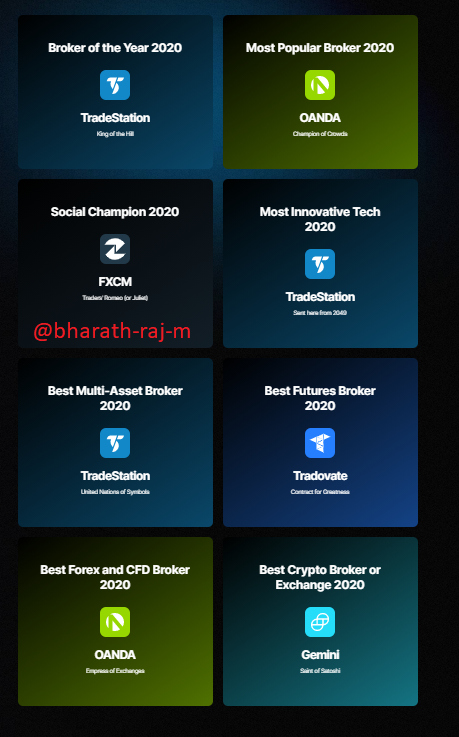
This feature provides the list of brokers available on the TradingView platform and the minimum amount one can start with. It also displays each broker's benefits and their maximum leverages as well. The brokers available provide the chance for every user to open an account on their platform. The available top brokers on TradingViewThe top brokers are; Capital.com, Currency.com, FXCM and The broker award option. It shows us the award was given to the broker websites.
- 3.Markets Feature
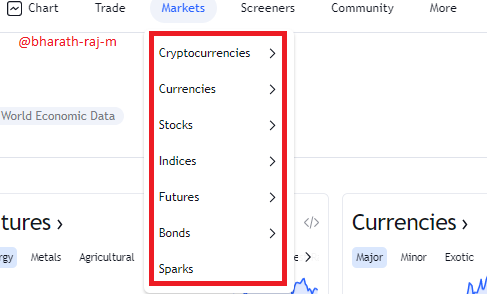
This market feature comprises different markets including cryptocurrency, Indices, Bonds, Money, Currencies, Futures, and Sparks. It displays all the available market sections in the TradingView platform. as we can see in the above screenshot.
Cryptocurrency:-
This option displays the prices of all cryptocurrencies available on the platform and This includes Deficurrencies, Defi Market Cap Charts, Market Cap Charts, etc.Currencies:-
This 2nd option displays a full list of all available continents and their pair of currencies in the TradingView platform. An example is when one click on Europe all available pairs of currencies of the European continent will be displayed in this option.Stocks:-
The 3rd option stock feature displays options including top gainers, top losers, Most Active, Most volatile, Overbought, Oversold, All-time high, All time low, High-dividend, Sector and Industry this feature is very useful for those who trade in the stock market they will get all type of information in a single place.Indices:-
This 4th option feature categorises indices in Major world indices, US indices, S&P Sectors, and Currency indices.Futures:-
This feature provides information on different areas of interest including; Currencies, Agriculture, Metals, World Indices, Interest rates, and Energy for example if we go inside agriculture we will see grains and oilseeds, livestock, dairy, lumber, softs, biofuels the details of linked to agriculture.Bonds:-
5th option we all know Bond means a relationship it gives the full details of The Bond feature provides information by classifying them based on continents types such as Americas, Europe, Asia, Pacific, Middle East, Africa and as well as Mahor 10Y.Sparks:-
6th option in this option we get an update of the latest news or any trending things.4.Screeners
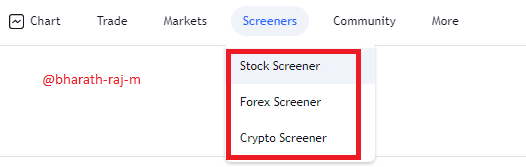
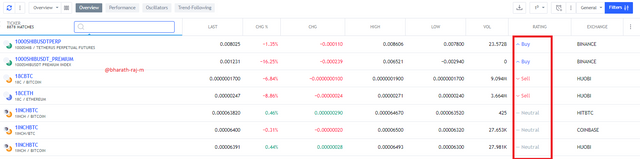
This feature also has there option which includes Stock screeners, Forex Screeners, and Crypto Screeners. They provide accurate results of assets within the TradingView platform by providing guidelines on when to go for a buy option and when to go for a sell option in the market, for example, we can see in the below screenshot when it has a strong buying it will show by when it as the strong sell it will show sell.
- 5.Community:-
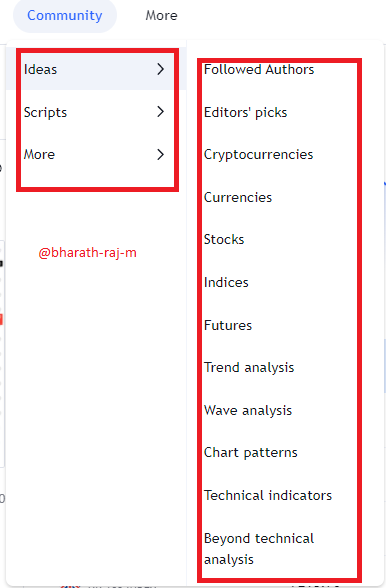
This feature of the TradingView platform as users can get several trending information that can be useful to gain an insight into a particular about the market. the users can follow different users and get timely information through their publications to stay on track with trending news on the market. This feature has four major options, there are; Ideas, Scripts, Streams and More. Importantly, this feature can be used for fundamental analysis as information gotten from the community can be used to gain insight into the market of an asset and this information includes the following; followed Authors, Editor's Picks, Currencies, Stocks, Indices, Futures, Trend analysis, Wave analysis, Chart patterns, Technical Indicators, etc.
- 6.More Option:-
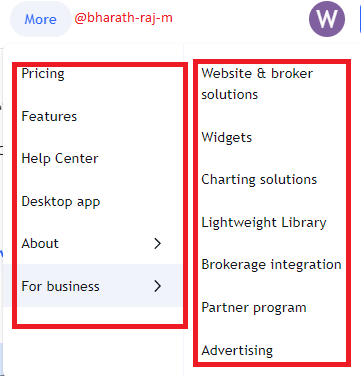
This option provides other relevant features of TradingView including; Pricing, Features, Help Center in the help centre we can contact customer care to get help from their side, Desktop app, About in about we will get the information about the trading view, and Business aspects.
what is your favourite feature and why? (screenshot necessary)
In all the features I have discussed above homework, my favourite feature is the Chart feature.
The reasons I choose the chart as my favourite feature.
because chat future contains all the information needed for a trader like chat indicators extra we can use chat to determine uptrend and low Trend and it as varieties of indicators to put it simply chat is the lifeline for a trader so my favourite future chats future.
3.- How to set up a chart in TradingView and use two tools to edit it.(screenshot necessary)First, click on the Chart tab at the top screen of the homepage of TradingView after login. I would be using NIFTY in this setup.
- Now, click on the Settings icon on the top right corner of the chart window.
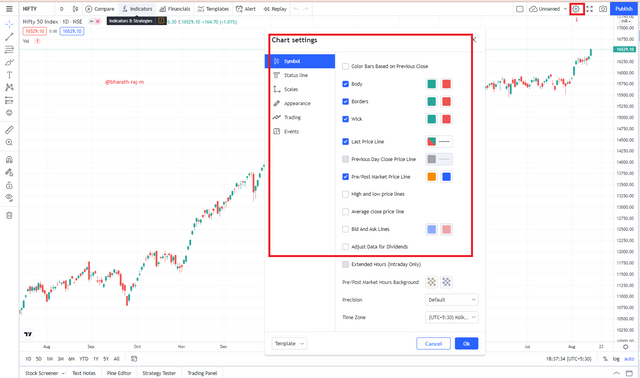
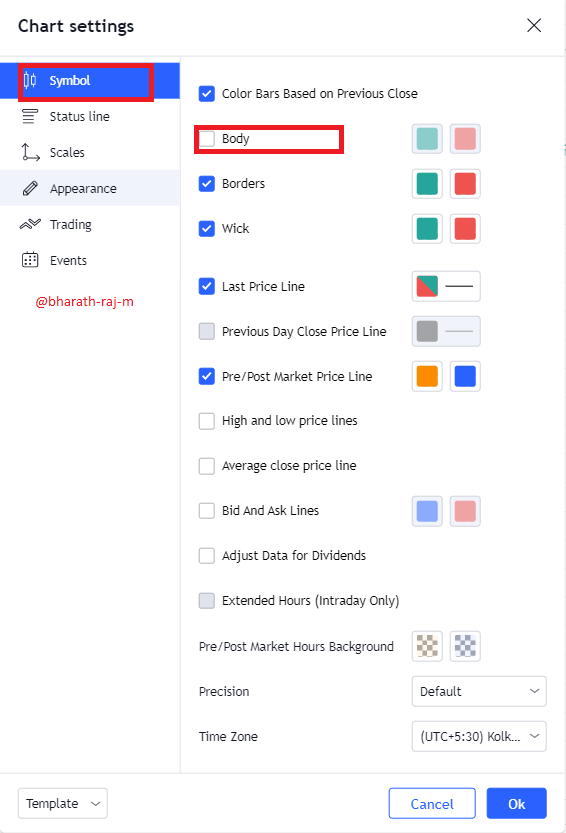
- From the chart settings, I would be using the Symbol tools here in making my edits on the chart
first, click on the symbol and it will show you many options untick the body option in the symbol so the chat will look more professional and clean and also you can change the colour of the body and outline if you want to change it you can do it from the symbol option.
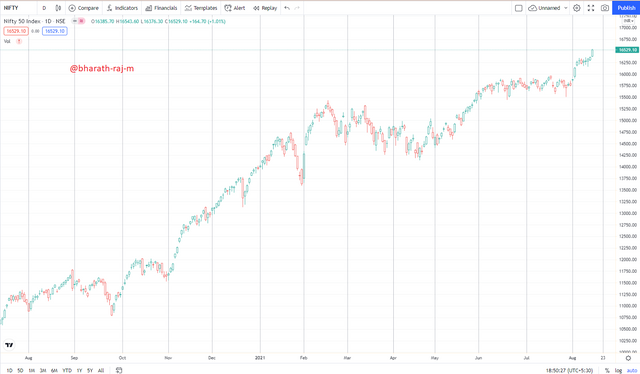
- Now click on the Appearance to edit the appearance settings now click vector and increase the opacity 100 so it will form a line at the end of every time frame it will help us to identify the time frame very quickly.
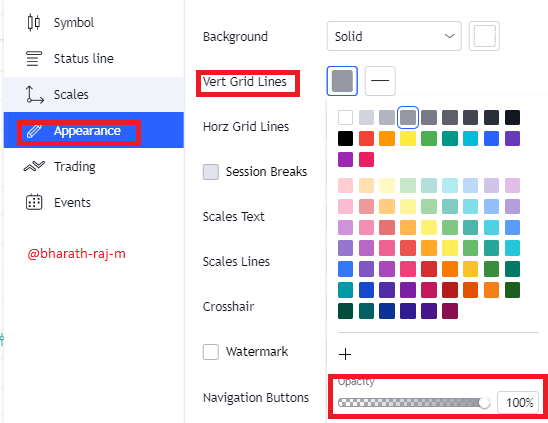
- Now click ok to save all the changes we have done.
4.- Explain how to add indicators in the chart, what is your favourite indicator and why? (screenshot necessary)inside the chat in the top 5th option indicators option click on that, it will open indicators and strategies options there to search your preferred indicators it will show your indicator just click on it to apply I have chosen two indicators moving average and Parabolic SAR, MACD.
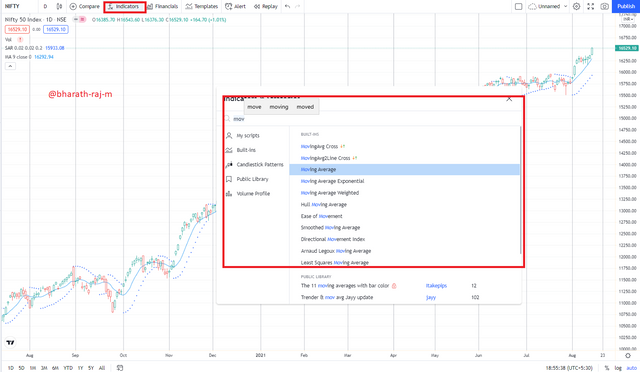
favourite indicators are moving average and Parabolic SAR, MACD because these three settings are very useful for day trading it has 70% of success rate and I also used this daily because this is my favourite indicator.
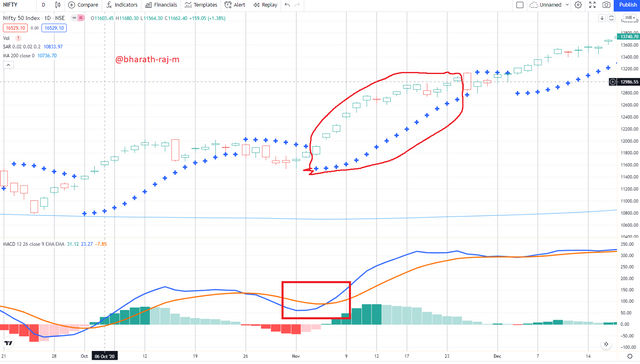
It is very easy to use there are only three conditions the moving average should be below the candle and the blue line must cross the Yellow line from below in MACD and the Parabolic SAR date must be below the candle as we can see in the below screenshot if three conditions are met we can go for the buy.
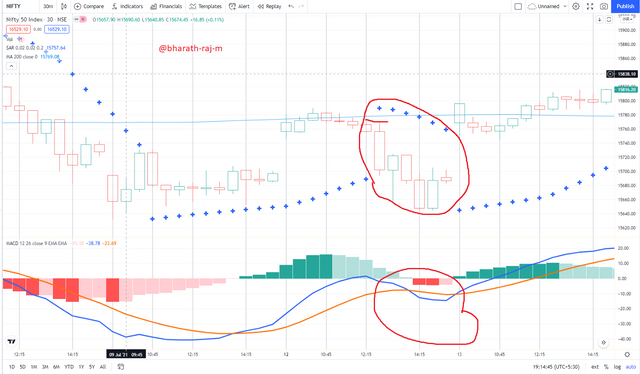
selling also there is three conditions to be met before selling using this indicator moving average should be below the candle and the blue line must cross the Yellow line from above n MACD and the Parabolic SAR date must be above as we can see in this second screenshot.
5.- Do you think TradingView is useful in predicting the market for a cryptocurrency (trend/price)?)TradingView is a very useful tool for trends in the cryptocurrency market and techniques and analysis strategies this all are found in trading view. On the other hand, the chat with traders is also presented as an advantage to know their ideas about the projects. The fact that the platform shows in real-time what is happening in the crypto-assets market and the different exchanges worldwide is an advantage to carry out predictions, in the graphs tools such as indicators and strategies we can select a timeline that allows us to create an idea of the trend that has dominated in an asset either up or down.
The TradingView platform allows traders to be educated and also have access to the trending news of brokers and in the crypto market through the community feature. the prediction of the price of assets in the TradingView platform is through indicators and also through historical data of assets.
I use the TradingView for technical analysis and it has always come with positive results having my trade setup end up in the direction of prediction It is important to also note that outputs of trade setup using the TradingView should be carried out properly to maximize a positive output and using tradingview also we can see the setup we have done in our system in our mobile.
For me the trading view is very much useful intense of price prediction, not just that it's pretty fantastic to understand and trade on it too, I so much like the way the exchange works.
6.- CONCLUSIONTradingView has been a top-rated platform for trading analysis by many traders in the crypto space and others, and several features this was an opportunity to expose my experience in tradingview tradingview is and very good platform where we not only perform cryptocurrency market but also various kinds of markets in the tradingview the best future I like is the thing which I do in the pc can be monitored in my mobile app simply put the best place to perform the trading strategy is tradingview thank you, professor, @yousafharoonkhan for giving this wonderful opportunity to explain about tradingview.
Respected first thank you very much for taking interest in SteemitCryptoAcademy
Season 3 | intermediate course class week 7
thank you very much for taking interest in this class,