Steemit Crypto Academy Season 2-Week 8 | Cryptocurrency Trading with Bollinger Bands
Define the Bollinger Bands indicator by explaining its calculation method, how does it work? and what is the best Bollinger Band setup?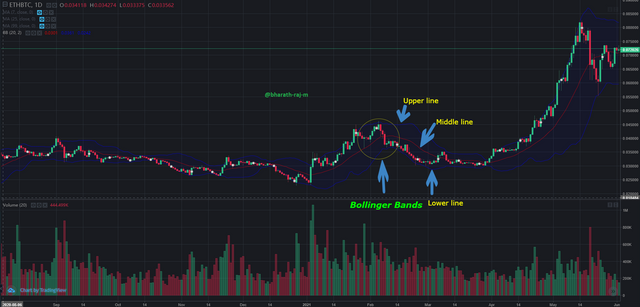
Bollinger Bands is a simple moving average based technical analysis tool developed by John Bollinger in the mid-1980s for generating oversold or overbought signals. A Bollinger Band is composed of three lines or bands the upper line is set plus two standard deviations and the above the simple moving average and the lower line is set at minus 2 standard deviations below the simple moving average The middle line represents the simple moving average and. The simple moving average that is commonly used in Bollinger bands is 20 - days SMA. It is not fixed, it can be changed but the best results have been seen by trading professionals with this reference. So the best set-up is 20 days SMA and + 2SD for the upper band and -2SD for the lower band.
10 Days moving average is used for short term
20 Days moving average is used for medium-term
50 days moving average is used for long term
The main concept needs to understand is the Simple Moving Average concept. AS I was taught simple average as the sum of observations divided by a number of observations, For this example, a trader is doing do any crypto or any other trade for a month and at the end of that month, he is having different profits on different days, like 0.17 BTC on day 0.24 BTC on day 2, 0.34BTC on day 3 and so on and so forth. But at the end when we ask for the average profit, he won't say individual figures but he has to sum up all the profits for 30 days and divide that sum by 30.
This is concept Applying for the 20 - days SMA. It would refer to the simple average of closing prices of asset under consideration for 20 days.
Standard deviation as the name implies would mean deviation of price from the standard price. Here standard price would refer to the price indicated by 20 days SMA. Any upward movement in the price above SMA would be a positive deviation and any decrease from SMA would mean negative SMA. In Bollinger Bands for upper band and for lower Band are considered.
There is one more parameter in Bollinger Band which is Volatility or Standard Deviation, and as in default, it is 2 Standard deviation because we are using 20 days of Moving Average. but if we use 10 days of Moving average the Standard deviation will be 1.5 and if we use 50 days of moving average the standard deviation will be 2.5.
This is a simple working methodology that has been developed for the calculation of Bollinger bands.
When the market price touches the upper band of the Working of Bollinger Bands Indicator then this shows an overbought zone and a price reversal is going to happen when the price touches the upper band a price reversal happens and the price goes down Downward trend.
Same as Downward trend and it is Reverse it When the market price of the cryptocracy touches the lower band this means an oversold zone and the price will be reversal happens afterwards. when the price of the cryptocracy touches the lower band it shows reversal is going to happen and the price goes upward Upward trend.
This is another important thing to note that we can find out using Bollinger Bands Indicator. As the width of the bands decreases so decrease the volatility means when the width between bands is low then this indicates lower volatility. When the width between bands is high this indicates high volatility.
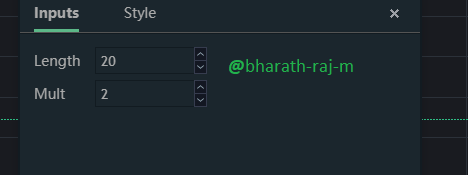
Length: default at 20 means it is moving an average of 20 days.
Standard Deviation: It has to set at value 2 means +2/-2 Standard Deviation from moving average.
This default Bollinger Bands set comes with a middle band which represents a 20-day moving average. However, this would be for a trader who wishes to hold positions for more than 20 days. For an intraday trader, you can set it to 20 minutes, Using volatility to determine the location of the bands and also using 2 standard deviations both above and below the price movements.
This is the best setup for Bollinger Bands Indicator because it gives the best indications at these settings. It is easy to use at default settings which are best for trend analysis.
What is a breakout and how do you determine it? (Screenshot required)The breakout means when the price of a cryptocracy breaks the previous resistance or support levels.
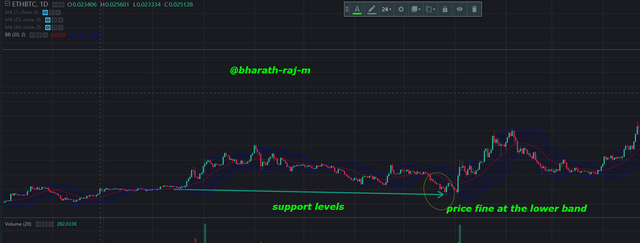
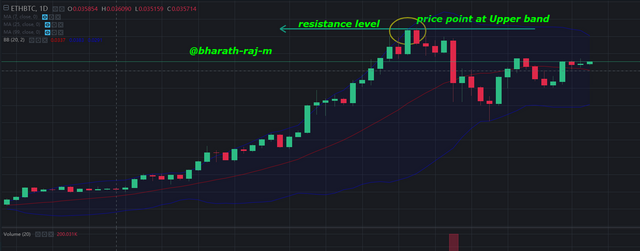
Breakout in upward trend happens when the price of cryptocracy breaks the resistance level. This breakout is an indication of a strong bullish trend buying. same as resistance it is been reversed here Breakout in downward trend happens when the price of cryptocracy breaks the support levels. This breakout is an indication of a strong Bearish Trend.
support levels
resistance level
To determine breakouts with the help of Bollinger bands we will have to look for "Bollinger squeeze". It is an important concept that lies at the heart of Bollinger bands. It refers to constriction of the gap between upper and lower Bollinger bands resulting in a squeeze of SMA in between. Bollinger squeeze, therefore, signals lesser volatility and imminent price breakout. One thing to remember here in this context is that price breakout refers to the movement of price above resistance or below support but not movement above or below Bollinger bands. Most of the breakout (85 to 90% approx ) take place within Bollinger bands and a smaller number of breakouts can take place outside of bands too.
How to use Bollinger bands with a trending market? (screenshot required)So by the word trending market, I learn that here we are talking about the market with wide bands of Bollinger bands, and sometimes the market goes up and sometimes the market goes down, which means in the trending market sometimes the market is in Uptrends and sometimes the market is in the downtrend. When the bands are moving in an upward direction then it is a situation of an upward trend and when the bands are going in a downward direction then it is the situation of a downward trend.
Bollinger bands can be used when we are trying to understand how strongly crypto may be rising and they can be also used to determine when the crypto is losing strength. Usually, a strong uptrend reaches the upper band quite regularly. When an uptrend reaches the upper band it indicates that the crypto is gaining more strength and pushing up even higher. This would be a good time for buyers to come in. When prices pull down from the upper band, come down to the middle band and go up again to the upper band, it indicates a market with a strong uptrend. A market in the uptrend is not expected to touch the lower band. If this happens then it is a sign that the market is possibly going to reverse. Also, it could mean that the crypto is losing some strength.
The price chart above indicates a market trend that is trading in the regions of an uptrend. As a technical trader, you should hope to benefit from the uptrend before a reversal sets in. If the crypto fails to reach a new peak after some time this will be a good place to take profit to avoid possible incoming price reversal. Monitoring the strength of the uptrend or the weakness of it is a vital metric for technical traders. So, it is important to monitor and know how strong the uptrend may be in order to be able to decipher when a downward reversal is imminent due to a weakening uptrend, The uptrend is also called an overbought market, in which prices go on high prices and it is said to be an overbought market as the buyer has bought a lot and then they became seller and start selling it to the other buyer with their profits and with this, the market comes to the middle line.
Importantly, traders can sell short whenever the prices of cryptocurrencies pierce and shoot out above the upper band of the Bollinger Bands. Such points of outward price shootouts above the upper band of the Bollinger Bands is as represented below:

The downtrend market is also called an Oversold market, as in this the buyer who has bought it already became seller and start selling their asset and the price of the asset decreases and that made a market, an oversold market.
Again, Bollinger bands can be used in determining how strongly the price of a cryptocurrency is falling. This would be instrumental in giving information on when it is about to result in an upward reversal. Usually, when the downtrend is strong the price would keep running along with the lower band as a way of indicating stronger selling activities. However, if the price is no longer running or fails to touch the lower band then it is a sign that the downtrend in price is losing a lot of momentum. Anytime a pullback (new high) is made and the price does not go above the middle band but falls back to the lower band it is an indication that the downtrend is still strong. It is not expected that the price would go above the middle band. If this happens it is an indication that the downtrend is losing strength or maybe about to reverse.
The price chart above shows the market trend that is currently experiencing a downtrend in price action. Normally, traders like avoiding downtrends when it comes to trading. These downtrends could last for a short or even longer period. It could last a few minutes, a few days or even a few months or years. The Bollinger Bands can be quite instrumental in helping traders to identify an impending downtrend early enough. This will be helpful in making them protect their investments as traders are usually mindful and careful to avoid downtrends that may not result in any profitable trade.
So as we already knew that our period is on 20 days and we have an upper and lower line with the difference of 2 Standard deviations with the bottom line, so when the candles are in the lower band that means that the market is cheap right now so it is the time to buy.

What is the best indicator to use with Bollinger Bands to make your trade more meaningful? (Screenshot required) (Screenshot required)the best indicator pair up with Bollinger is MACD and RSI, it would make a perfect and reliable combination of indicators. Shortcomings of anyone may be compensated and cross-checked by the other two.
The MACD (MOVING AVERAGE CONVERGENCE DIVERGENCE) is a simple tool but most effective as a trading indicator MACD tool is used to identify the new trend of a market and its bullish or bearish.
MACD indicator was developed by Gerald Appel in the late s the 1970s for trend-following momentum indicator and oscillator and MACD (MOVING AVERAGE CONVERGENCE DIVERGENCE) INDICATOR SHOW THE RELATIONSHIP BTW two moving average and also use for identity the enter and exit point form trading or market stock
RSI (Relative strength index)
Then, set up the RSI with 70 and 30 indicating the overbought and oversold regions respectively. After that, you change the length of the RSI from 14 to 13. This will be necessary for this particular strategy.
Let's try to review the above chart of ETH/BTC, the lower Bollinger band that is perceived by traders as an overbought cry and expect subsequent price correction. The same can be confirmed by the RSI value touching 70 above in the same period, When prices have moved outside the upper band we will wait for the RSI to hit an extreme value of at least 75 before entering a sell trade and even further down a bit later. So when both Bollinger band and RSI are used together, we are in a better position to make trading decisions.
the same can be verified by MACD cross over as indicated by arrows and we know in MACD cross over has great significance in trading. So both of them taken together can serve as a good trading tool when the 12 period goes below the 26 periods and the 26-period rise above 12 period in zero line there is potentially a sell signal.
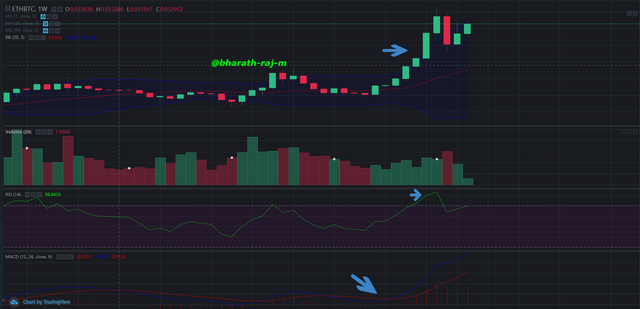
As we can see these are the best three tools or indicator we can use with Bollinger Bands.
What timeframe does the Bollinger Bands work best on?And why? (Screenshots required)To be honest speak I don't think there is any particular timeframe on which Bollinger bands which work best on, as we have seen the charts of the different time frame and Bollinger bands work best on every time frame.
it depends upon the trader who uses is if the trader is good with the indicators, the basically there are only two-time frame short term long term the trader who uses the short time select a short time frame like that the trader who uses long-term uses.
To understand clearly I will give an example for the short term from one minute to one day short term it means the short time traders use it this time frame as we can see in the screenshot the highlighted parts are short-term trade it means 6 term timeframes and three days to one month is long term it means the long time frames we can see in the image.

1 Hr Time frame.

1 Day timeframe

So as we can see that in the 1-day timeframe the market is in a downtrend but in a 1 Hr time frame the market is uptrending, and it may go down, so that is why I prefer a 1 day or weekly timeframe as it shows the big picture of the market.
For swing trader or for holding, larger time frames are best like daily and weekly time frames
This is because for long term investors price history is important to know how the price of crypto performs from a period of time. This time frame helps you to find resistance and support levels easily. This time frame also helps you to find out trends in price crypto.
So, we use different time frames for different traders in Bollinger Bands Indicator.
Review the chart of any pair and present the various signals giving by the indicator Bollinger Bands. (Screenshot required)
Resistance and support levels are respectively at upper and lower bands which are easily detected with indicator. You can see them in the above photo
ETH/BTC indicating overbought and oversold points and therefore sell and buy signals respectively. For buy /sell remember, if the price crosses the middle band from below upward, it is a bullish signal and if it crosses the middle band from above downwards, it is a bearish trend.
When the price of CRYPTO touches the upper band then it indicates Overbought zone and a price reversal happens afterwards
When the price of CRYPTO touches the lower band it shows an Oversold zone and a price reversal happens afterwards.
When price moves below middle band it is signal for sell
When price moves above middle band it is signal for buy
Support and Resistance for ETH/BTC. As seen above, support and resistance coincide with the falling and rising ends of lower and upper bands respectively.
Firstly as there was a thin band and has a low volatile market and after the thin band, there is a breakout which causes the market to go into bullish than there that there is an overbought market, which is on resistance level and the market is in an uptrend and with that after the overbought market when the buyers start selling to make profit the market goes into the oversold market and the prices of the asset became cheap at that moment and are the time to buy.
conclusion
In conclusion, I would say Bollinger Bands Indicator os another great technical analysis tool which is really helpful for all kind of traders. This tool helps you to find out the trend, support, resistance levels, entry and exit points AND but every trading indicators has its pros and its cons the trader must be aware of that and use it wisely.
Hello @bharath-raj-m,
Thank you for participating in the 8th Week Crypto Course in its second season and for your efforts to complete the suggested tasks, you deserve a 7.5/10 rating, according to the following scale:
My review :
Overall a good article in which you answered all the questions based on a clear research effort. What is wrong with you is the lengthening of the interpretation, which causes you to repeat the idea without feeling and makes reading boring for us. Try to simplify it at the latest in five lines and link it with another idea in a way that makes the reading sequential.
Thanks again for your effort, and we look forward to reading your next work.
Sincerely,@kouba01