[CRYPTO TRADING STRATEGY WITH MEDIAN INDICATOR]- Steemit Crypto Academy- Homework post for Professor @abdu.navi03 | by @benjamin09
1-Explain your understanding with the median indicator.
When looking at charts, (whether forex, stocks or crypto) in order to analyze the market, we will need to carry out a technical analysis. There are several technical tools which can be used such as market structure, resistance and support lines, and also technical indicators. Indicators analyze price data and thus help to give signals for good trading decisions. Among indicators, there are those that are most used to identify and trade with trends. A good example of a trend based indicator is the median indicator.
The median indicator is a trend based indicator that analyzes and measures the market direction and determines the market phase, whether trending or ranging. Unlike the moving average which shows the average price per the selected period, the median indicator shows the median price for both the high and low levels for the selected period.
It is made up of a thick line that moves on the price and varies in color depending on the market trend. For the bearish trend, it has a thick purple line while for the bullish trend, it has a thick green line. Also, the median indicator has a green upper band and a purple lower band.
2-Parameters and Calculations of Median indicator. (Screenshot required)
In order for any indicator to be calculated, data and information is taken from the price in the market and such information may include open price, close price, low price and high prices that are gotten during the various periods. For the median indicator, what is used for the calculation is the Average True Range(ATR), the ATR multiplier and the median length. They are used to calculate the upper band and the lower band. The calculation is seen below.
Upper band = Median length + (2ATR)
Lower band = Median length - (2ATR)
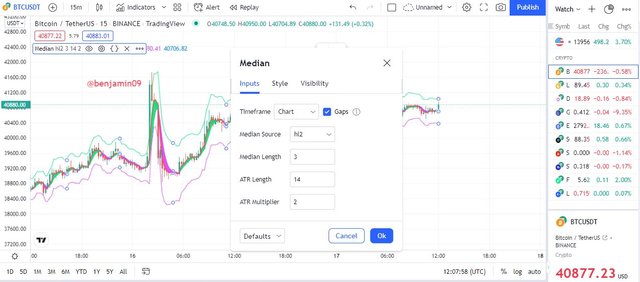
In the above image we can see the settings for the median indicator. The default for the median length is 3. Also the ATR length is 14 and the ATR is also 2. These settings can be adjusted by the trader according to his strategy. These figures are then used for the calculation of the median indicator.
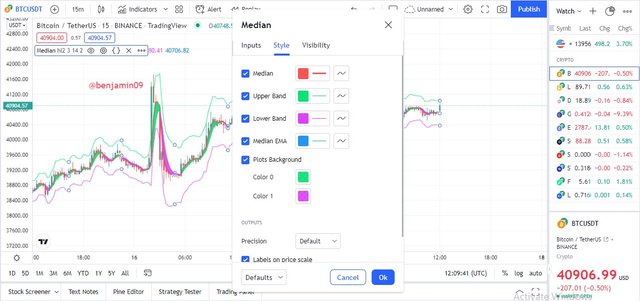
The above image shows the settings for the median indicator and the various colors which can be styled in the median indicator.
3-Uptrend from Median indicator (screenshot required)
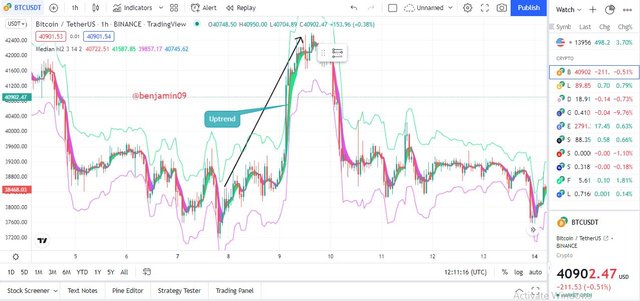
In order to identify an uptrend for the median indicator, the median line on the candlesticks will need to be green and moving upwards with the candles. This will indicate the high buying power in the market during the period. The uptrend will come to a close when the median line turns purple and the price moves downward. We can see an example below.
In the above BTCUSDT chart, we can see that the price was in a range with the median line turning green and purple until the start of the bullish trend when the price started moving upwards and maintaining the green median line. This is an uptrend as is identified by the median line. The trend ends when the median line turns purple.
4-Downtrend from Median Indicator (screenshot required)
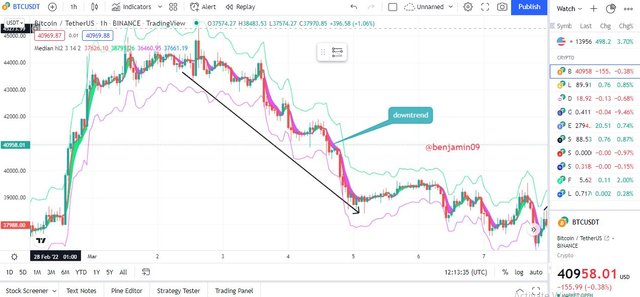
During a downtrend, the median indicator will be such that the median line will be purple and moving down alongside the price. The downtrend ends when the median line turns green as the price moves upwards. We can see an example below.
In the above BTCUSDT chart, we can see that the market entered a downtrend and started moving downwards as the median line was moving downwards with a thick purple line. The trend ended when the price turned green and the market changed direction.
5-Identifying fake Signals with Median indicator(screenshot required)
As we know, indicators are not always correct as they tend to give false signals. It is for this reason why it is best to trade with an indicator in confluence with another indicator or other technical tools. For this median indicator, I will be using the RSI indicator.
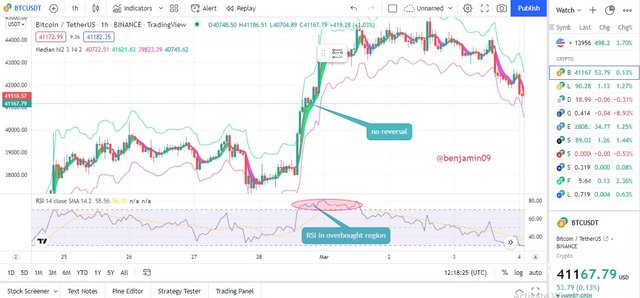
The RSI indicator works such that, when the price crosses the 50 level moving upwards, this is a bullish signal and when the RSI crosses the 50 level moving downwards, it is a bearish signal. Also, when the RSI crosses above 70, it is in the overbought region and acts like a bullish trend reversal signal. And when the RSI crosses below 30, it is a bearish reversal signal. Let us see an example below with the median indicator.
From the above BTCUSDT chart, we can see that the market was in an uptrend. Then the RSI entered the overbought region indicating a bullish trend reversal. But the median indicator still had the green median line moving upwards. This was a false signal from the RSI. This is why traders should wait for both the indicator to give the same signals so as to have a successful and filtered trade.
6-Open two demo trades, long and short, with the help of a median indicator or combination that includes a median indicator (screenshot required)
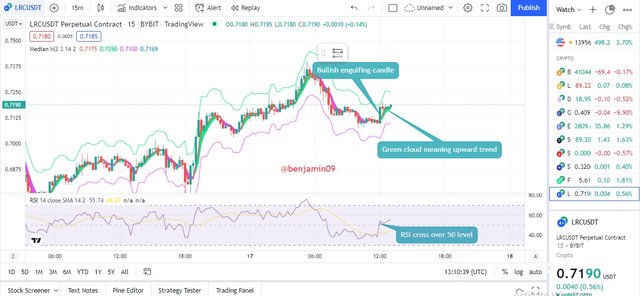
LRCUSDT BUY LONG.
From the above screenshot , we can see the green engulfing candle and then shortly, we see the median line forming a green line. Below, the RSI has also just crossed the 50 level signaling bullish movement. At this point, I placed my bullish trade. My exit point for this trade will be when the median indicator turns to purple.
Above, we can see the proof of the transaction which was done using Paper Trading on Tradingview.
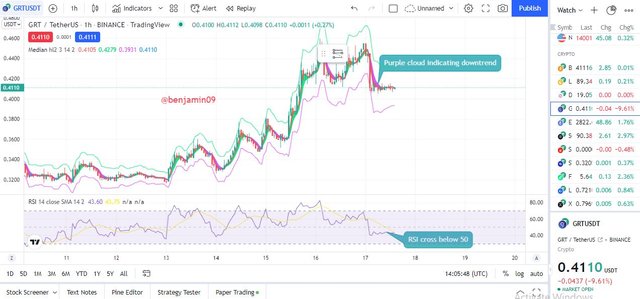
GRTUSDT SELL SHORT.
As is seen in the above screenshot, the GRTUSDT market had the median indicator forming a purple thick line moving down with the price. The movement slowed down for a while until the purple line showed up again indicating downward movement. The RSI had also just crossed the 50 level moving downwards. At this point, I opened my sell position.
We can see the transaction details above. The take profit or stop loss will be when the median indicator changes color to green.

Conclusion.
The median indicator is a very useful trend based indicator that helps traders to be able to easily identify and take advantage of trend movements. But just like all know, it is best to always trade using confluence trading as the other indicators help filter out the false signals of the other indicator.
Thank you for reading.
@abdu.navi03
