Trading with Accumulation / Distribution (A/D) Indicator - Crypto Academy / S4W5 - Homework Post for @allbert.
![AddText_10-05-06.10.20[1].jpg](https://steemitimages.com/640x0/https://cdn.steemitimages.com/DQmY1ZnFAhVhNaHRSCLUyrEpWAaG64q96a3akcxMFHdScJD/AddText_10-05-06.10.20[1].jpg)
Explain in your own words what the A/D Indicator is and how and why it relates to volume. (Screenshots needed).
A/D indicator is the abbreviated form of accumulation/distribution indicator, this indicator was designed by Mark Chaikin. The A/D indicator is a volume based indicator that is designed to calculate the volume of an asset been traded at a particular time.
What I mean is that this indicator is able to tell the phase or market trend an asset is in taking into considerations how the buying and selling pressure. From previous lessons I understand that there are phases in the market; there is a phase where a lot of traders show interest in an asset so they buy and hold on to the asset this will make the buying pressure to overcome the selling pressure causing an increase in price. This phase is known as the accumulation phase.
At times traders want to take profit after a run of an uptrend will now decide to put their assets up for sale and this makes selling pressure overtake buying pressure and hence a decline in price.
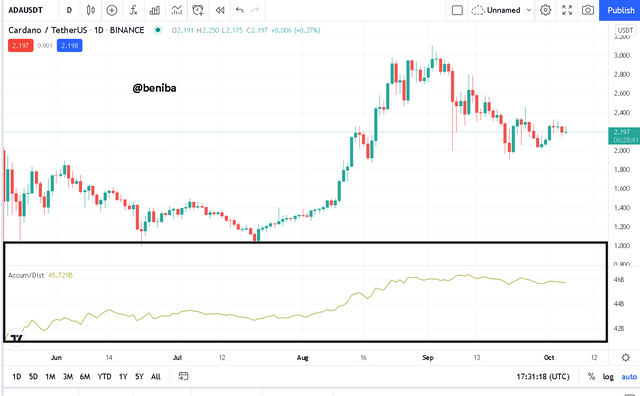
In essence A/D indicator is a line that is shown below the candlesticks representing price movements and gives information on the trend of an asset and is able to spot trend reversals. It is related to volume because it deals with the amount of asset that is been in circulation or been traded.

Through some platforms, show the process of how to place the A/D Indicator (Screenshots needed).
I will be showing the processes involved in adding the A/D indicator to a chart on tradingview
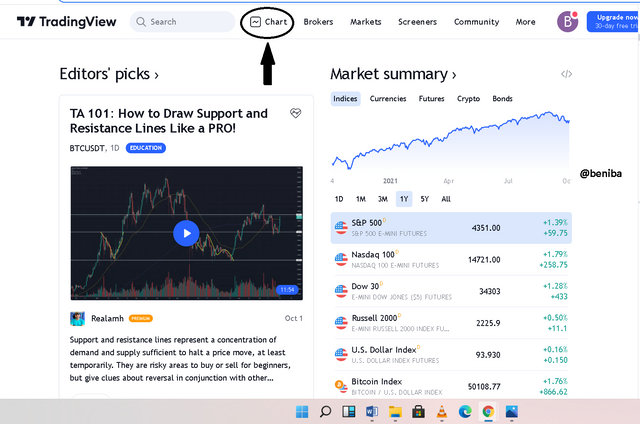
- Open the homepage of trading view via this link
- Click on chart as shown below.
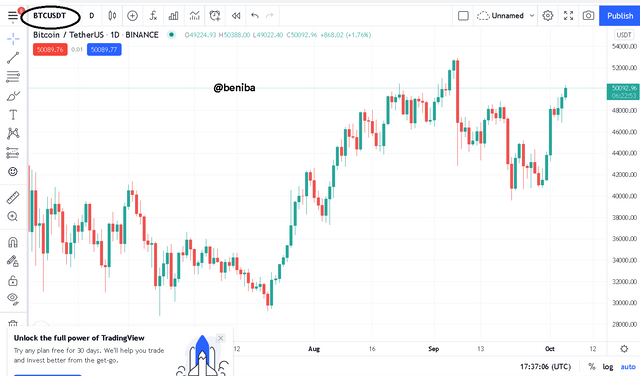
- Choose your cryptocurrency pair in my case I will be using BTC/USDT pair.
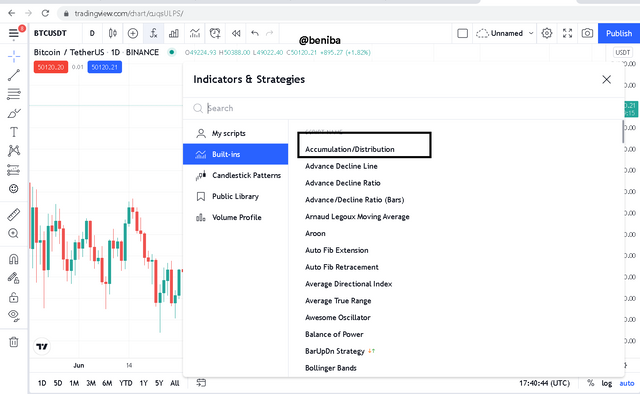
- Click on the indicators and strategies icon as shown below.
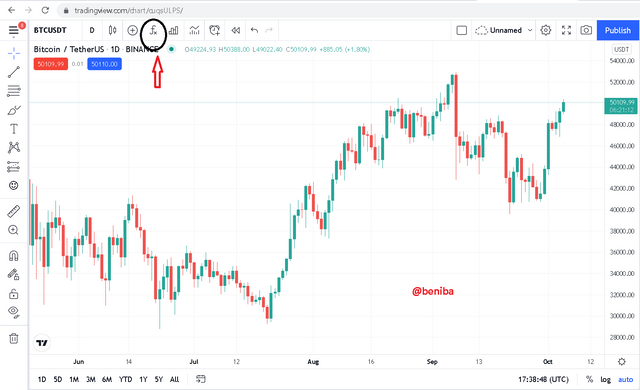
- It is displayed as Accumulation/Distribution indicator so you click on it
Explain through an example the formula of the A/D Indicator. (Originality will be taken into account).
The formula for Accumulation/Distribution is given as;
A/D = previous A/D + Current money flow volume (CMFV)
CMFV = money flow multiplier (MFM) *volume of the period
MFM= (Close−Low)−(High-Close)/ High−Low
where: MFM=Money Flow Multiplier
Close=Closing price
Low=Low price for the period
High=High price for the period
I will be using 24 hour TERRA statistics on coinmarketcap to explain the formula.
As at the time I was performing this assignment I had to find closing price of the asset and then the high and low price of the asset within the 24 hour period.
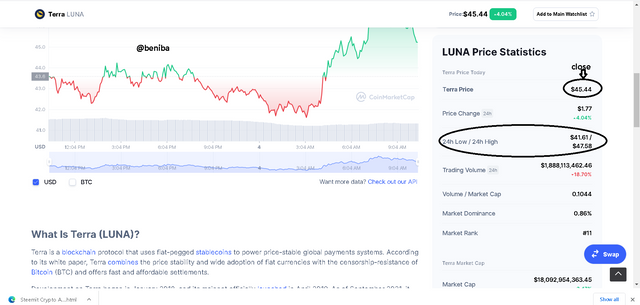
From coinmarketcap the figures are
Closing price = $45.44
Low price for the 24 hours = 41.61
High price for the 24 hours = 47.58
The next step is to put the corresponding values into the formula which is MFM= (Close−Low)−(High-Close)/ High−Low
(45.44-41.61)-(47.58-45.44)/(47.58-41.61)
=0.283 in 3 significant figures.
Therefore the money flow multiplier of terra is 0.283.
CMFV = MFM * VOLUME OF PERIOD
= CMFV = 0.283*1888113462.46
= 534336109.88
A/D = PREVIOUS A/D + CMFV
Because there is no previous A/D so you will use the value for Money flow volume.
How is it possible to detect and confirm a trend through the A/D indicator? (Screenshots needed)
As explained earlier it is line that drawn below the chart to reflect the price of an asset.
In a strong bullish trend the A/D indicator or line imitates the movement of the candlestick that is the line is seen to be moving in an upward direction hence confirming the bullish trend and on the other hand if an asset is in a bearish trend the A/D line moves in a downward direction signifying distribution and confirming the bearish trend.
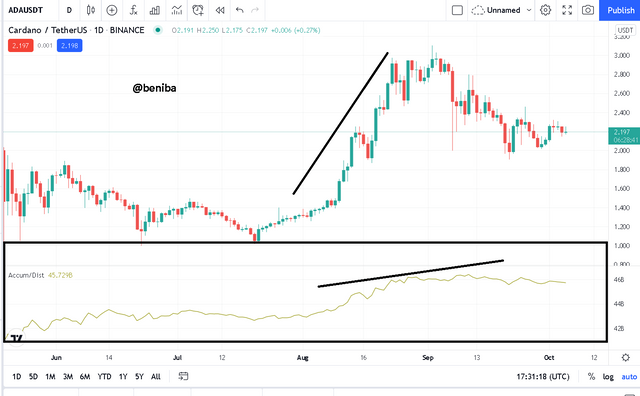
The A/D indicator can also detect a trend reversal, it does so by giving a movement that is opposite to the current market trend. That is the market might be in a clear bullish trend but the A/D indicator will be moving in a downward direction this signifies that selling pressure is increasing a bearish trend should be anticipated and vice versa.
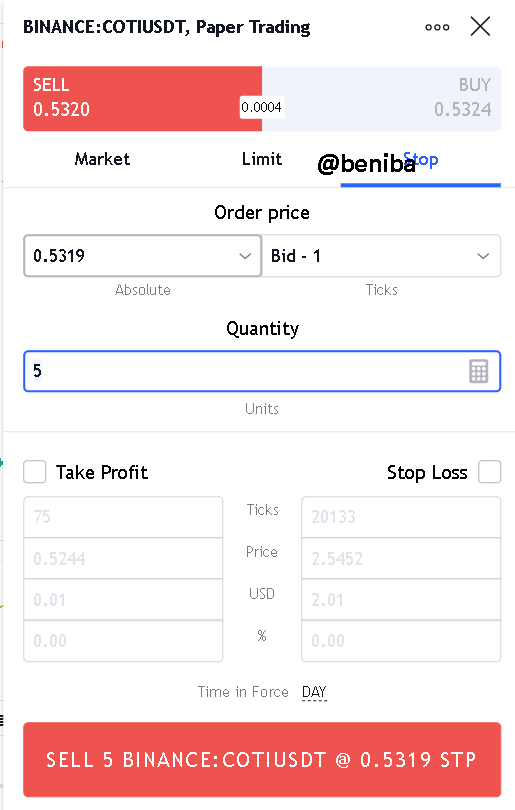
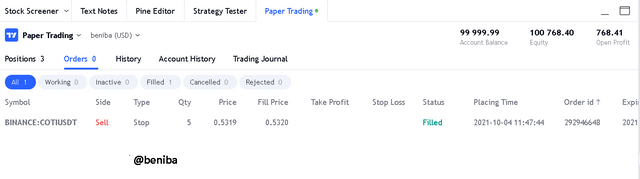
Through a DEMO account, perform one trading operation (BUY or SELL) using the A / D Indicator only. (Screenshots needed).
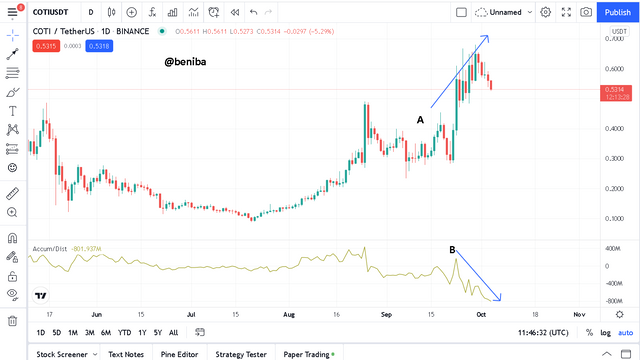
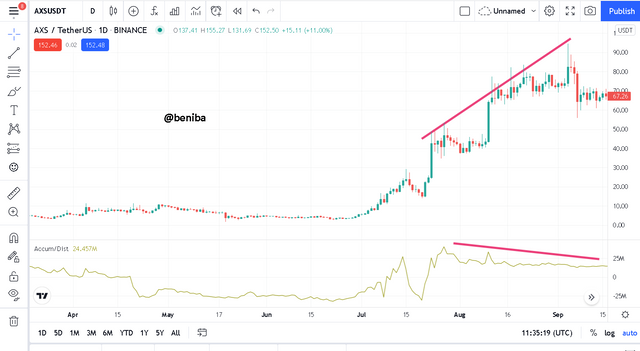
I opened the 1 DAY chart of COTI/USDT PAIR and used the A/D indicator on the chart I then realized that even though there was an uptrend in the market the indicator was going in the opposite direction. arrow A shows a clear uptrend in the price movement of the asset but arrow B on the A/D indicator showed a downward movement an this implies that bearish trend will soon be experienced so I decided to sell 5 units. Below are screenshots of the operation..
What other indicator can be used in conjunction with the A/D Indicator. Justify, explain and test. (Screenshots needed).
I think the stochastic indicator will be a very good indicator to be used with the A/D indicator in order to get good result. The purpose of using two indicators is to establish confluence. I chose the stochastic indicator because it is a momentum based indicator and at the same time a leading indicator that is able to spot trend reversals. A/D indicator is a volume based indicator so combining it with a momentum based indicator will give a very good result. I will be testing the two indicators on a chart below;
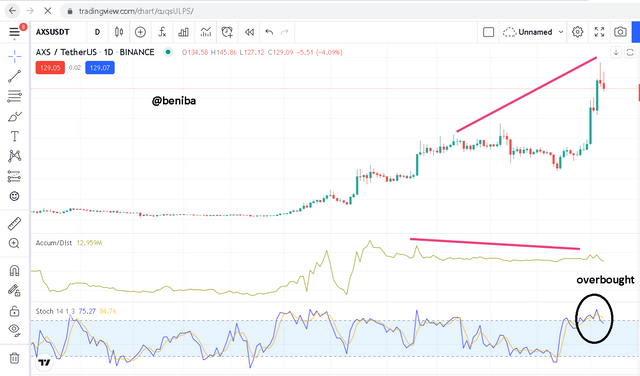
using the A/D indicator it is shown bearish trend should be expected and the stochastic indicator confirmed with the gib=ving overbought signals as shown above
Being a good crypto trader you will need to be doing very effective technical analysis. Knowing how to use a variety of technical indicators will be very instrumental.
A/D is a very good but simple indicator to use. One of its advantages is dependency on price action and volume. It also has its disadvantages just like any other indicator. It is not very sensitive so may give signals very late. Thanks to professor @allbert for such a lecture.