CRYPTO ACADEMY SEASON 4 WEEK 2 | TECHNICAL ANALYSIS | HOMEWOK POST FOR @reminiscence01
![AddText_09-12-08.31.29[1].jpg](https://steemitimages.com/640x0/https://cdn.steemitimages.com/DQmZF9bXrRGcnZsMXdum8gBqe36EyWr24ut1WvKBwLsza5N/AddText_09-12-08.31.29[1].jpg)
a. IN YOUR OWN WORDS, EXPLAIN TECHNICAL INDICATORS AND WHY IT IS A GOOD TECHNICAL ANALYSIS TOOL.
Technical Indicators are the graphical representation of price movements over a period of time in order to help in predicting the market trend and prices that are likely to occur in the future. These Technical indicators rely on past market prices and trends in doing the prediction. Technical tools serve as the bases on the foundation of technical analysis. Indicators play a very important because of it’s ability to generate signals using previous price data of an asset or commodity.
Technical indicators are good technical analysis tools because the versatility in has in functions. The basic aim of technical analysis to help investors in make the right decisions in their trade adventures. The technical indicators makes it possible by helping investors make prediction for market trends. Technical indicators generate buy or sell signals with the use of buy or sell demands in the market. Another reason why it is a good technical tool is because they serve as confirmation of market trend prediction when they are used together. That is one will confirm the prediction made by the other.

b. ARE TECHNICAL INDICATORS GOOD FOR CRYPTOCURRENCY ANALYSIS? EXPLAIN.
From my personal point of view I think technical indicators are good for cryptocurrency analysis because cryptocurrencies are very volatile and you can gain or loss a lot of money within a second. Going into a crypto trade you need to perform technical analysis on these asset. Technical Indicators have to ability to detect potentials market reversals and the continuity of current market trend. Technical indicators can be used on a any trade pair.

c. ILLUSTRATE HOW TO ADD INDICATORS ON THE CHART AND ALSO HOW TO CONFIGURE THEM. (SCREENSHOT NEEDED)
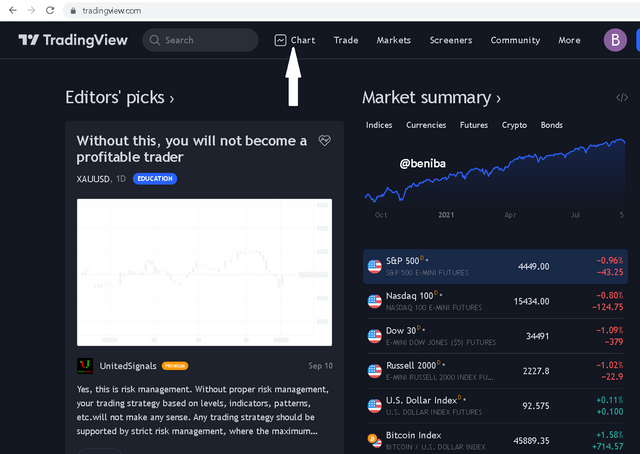
In this question I will illustrate how a technical indicator can be added to a chart on tradingview. tradingview link.
- Click on the link provided above in order to open the homepage of the website. You then click on charts displayed on the screen
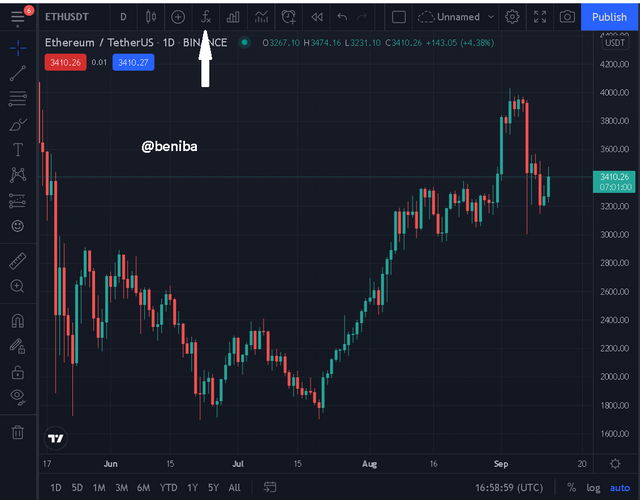
- A chart of ETC/USDT will be displayed, you click on the indicators and strategies denoted by (fx) symbol.
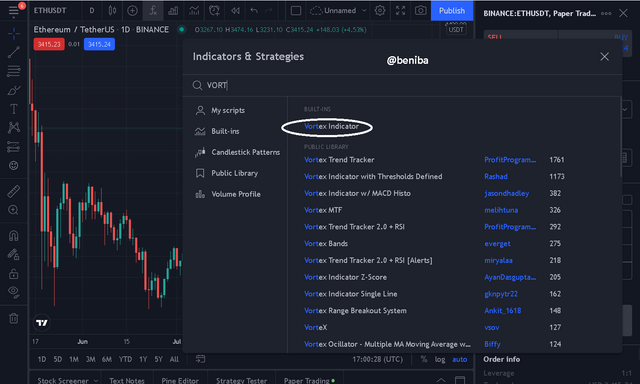
- From the list of indicators you select your preferred indicator or you search for it using the search buttom. I will select the vortex indicator.
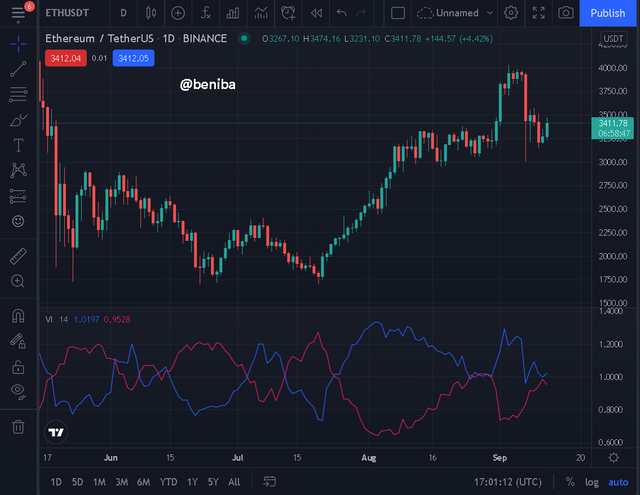
- The vortex indicator on the chart is shown below.
NOW ON HOW TO CONFIGURE A TECHNICAL INDICATOR.
I will continue by configuring the vortex indicator I just added to the chart.
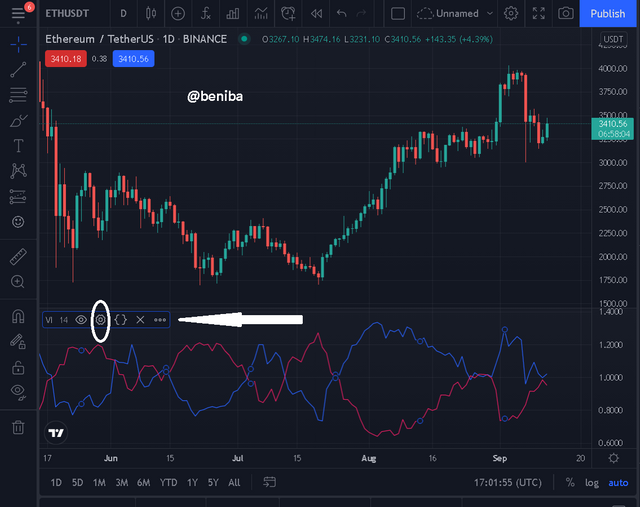
- You will now click on the indicator menu as shown in the screenshot below and click on the settings icon.
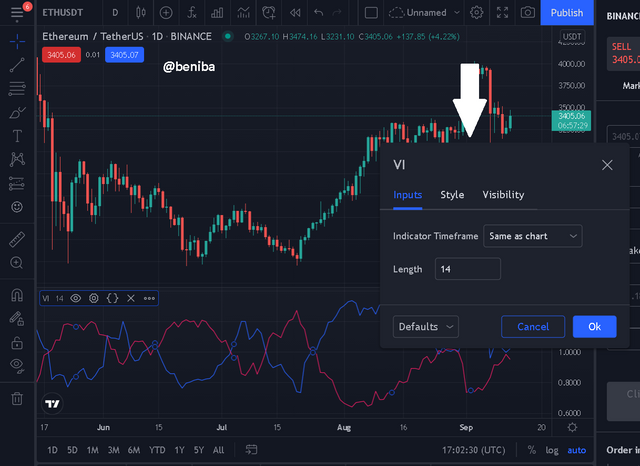
- A configuring box will appear so you can configure the input of the indicator by entering your preferred length.
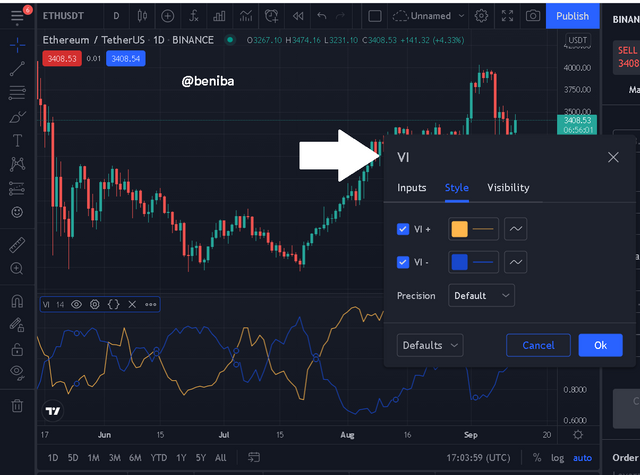
- You can move to modify the style of the indicator, I changed the VI+ to a yellow color and the VI- to color blue
- Same can be done to the visibility of the indicator.
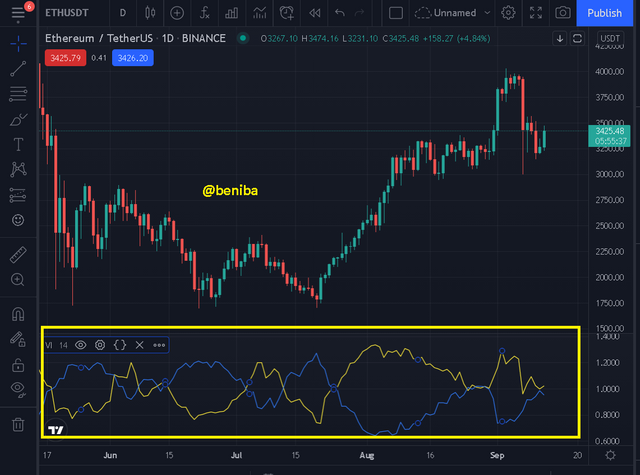
A CONFIGURED VORTEX INDICATOR.

a. EXPLAIN THE DIFFERENT CATERGORIES OF TECHNICAL INDICATORS AND GIVE AN EXAMPLE OF EACH CATEGORY.ALSO, SHOW THE INDICATOR USED AS AN EXAMPLE ON YOUR CHART.
Momentum indicators are indicators that are used to indicate how strong an existing trend is and in addition spots market trend reversals that will occur soon. In effect it tells a trader when to hold on an asset and when to take profit. Examples of momentum indicators are : Relative Strength Index (RSI), Stochastic etc.
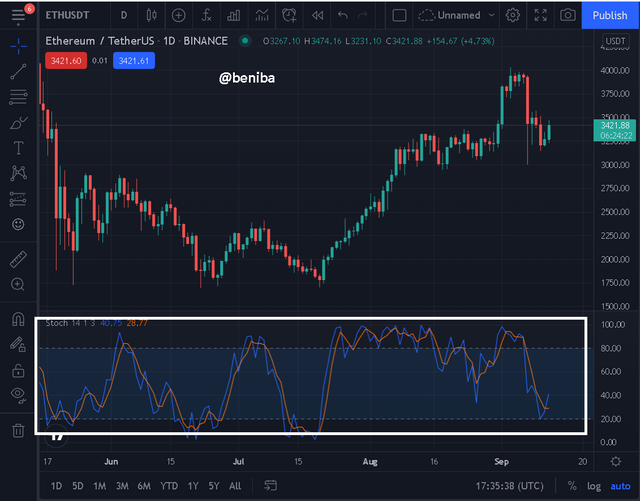
STOCHASTIC INDICATOR USED ON A CHART
Volume indicators are indicators that are designed tell analyst the rate at which the trading volume of a commodity Is changing over a period of time, how many units of a commodity Is been trader within a time period. A bullish trend is strong on commodities with high trading volumes and the vice versa. Example of volumes based indicators is On-Balance Volume.
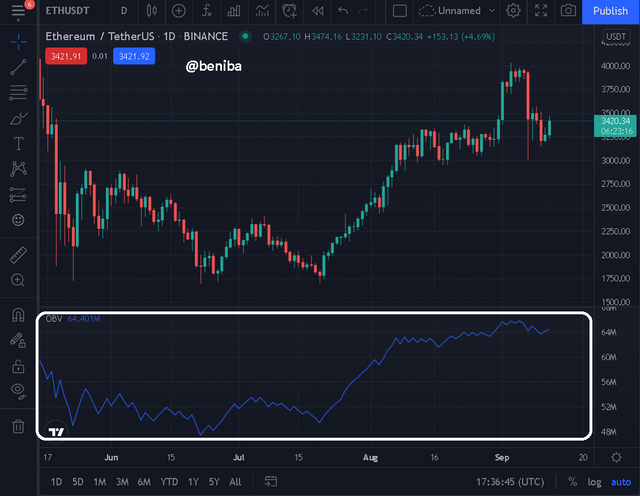
ON-BALANCE VOLUME INDICATOR USED ON A CHART
Volatility indicators. As we know already volatility refers to how unstable prices are, and how often these price changes occur. So volatility indicators are indicators that shows how much a price of a commodity is changing within a specific timeframe .It doesn’t really show or give insight into the direction of market trend or possible reversals but it shows how fast or often the prices changes. Assets with higher volatility experiences price fluctuations very often and the vice versa. Example of volatility indicators is bollinger bands.
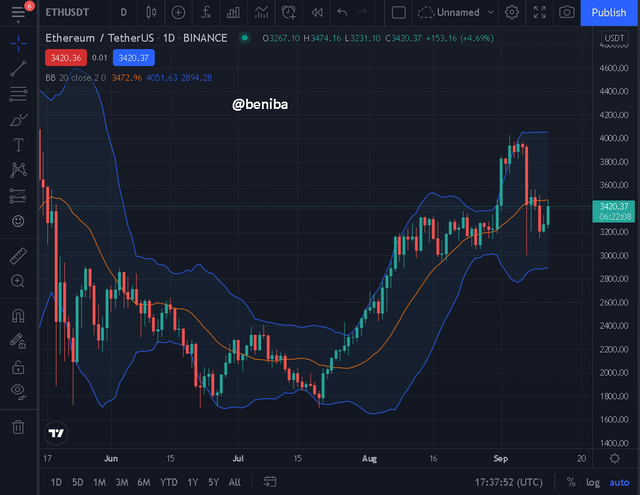
BOLLINGER BAND ON A CHART
Trend indicators are indicators that are designed to indicate the direction or trend a market is in. They move in the form of waves following the trend that has been established. Examples of trend indicators include Parabolic SAR, Ichimoku Kinko Hyo, Moving Average Convergence Divergence (MACD) etc.
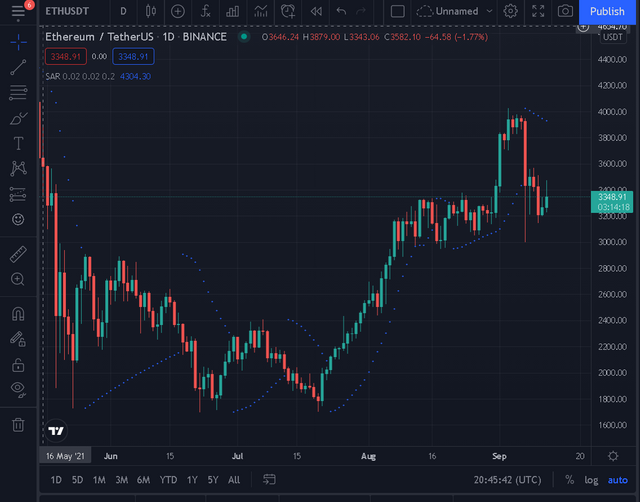
PARABOLIC SAR ON A CHART

b. BRIEFLY EXPLAIN THE REASON WHY INDICATORS ARE NOT ADVISABLE TO BE USED AS A STANDALONE TOOL FOR TECHNICAL ANALYSIS
Using a single technical indicator can be very detrimental to an investor because these indicators work more effectively and are accurate when used together. A single indicator may give a misleading prediction because of what it depends on. So using a variety of indicators will help you confirm if the prediction made by one indicator is accurate or not. When you use about 3 indicators and they all give same signals then you will be sure it’s a right signal. But you can’t conform if you are using only 1 indicator

c. EXPLAIN HOW AN INVESTOR CAN INCREASE THE SUCCESS RATE OF A TECHNICAL INDICATOR SIGNAL.
In order for an investor to increase the success rate of a technical indicator signal, the investor is required to understand exactly how indicator works and the right parameters to use. It is advisable to use multiple indicators in order to get accurate signals but these indicators shouldn’t be of the same type as it may give misleading signals but rather the indicators should be of different types. For example you can use a trend based indicator and momentum based indicators for a better results.

In crypto trading we are aware that there are two types of analysis that can be done an asset. One of which is technical analysis hence understanding the fundamentals of it is very important. Technical indicators are the bases on which proper technical analysis are done. These indicators are designed based on certain aspects of the market which are: volume, volatility, momentum and trend. This lesson has been a great one. Thanks to professor @reminiscence01 for such a great lecture.