Crypto Academy / S5W3- Homework Post for @reminiscence01".

a) Explain your Understanding of Trend Reversal. What is the benefit of identifying reversal patterns in the Market?
b) How can a fake reversal signal be avoided in the market? (Screenshot needed).
From the knowledge I have in crypto market I can say that no trend can last forever. At a point the current trend will be exhausted and a new trend will take over. Considering the volatile nature of cryptocurrencies we expect to see price movements that do not follow the current trend. The action of a market to track back and move in the opposite trend is called trend reversal Thus when a market has been in a bullish trend for some time and then begins to move in the opposite direction that is a trend reversal experienced.
It is obvious that every trader on the crypto market is there to make profit. His ability to spot or identify a trend reversal gives him or her the advantage in realizing his or her aim. What I mean is that a trader might have bought at the beginning of a bullish trend and the market keeps being in the bullish trend and he decides to hold on to the asset. There will be a point in the market where a trend reversal will occur and his ability to identify the trend reversal as early as possible will make him take profit before the bearish trend completely takes over.
In essence the benefit of identifying trend reversal is that traders get to know when there should buy an asset and when to sell an asset in order to make profit.
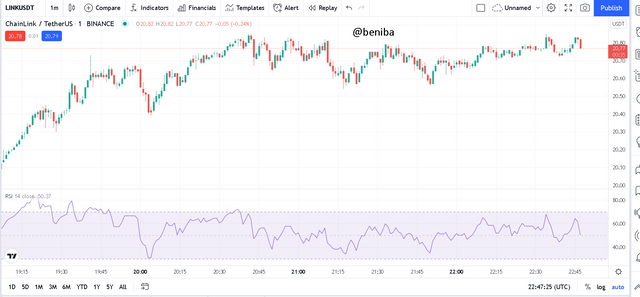
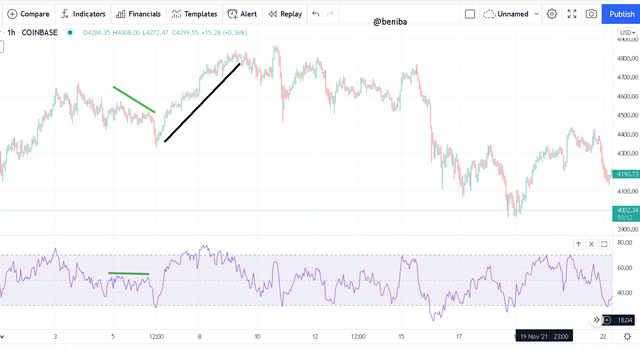
B. The truth about technical analysis is that no technical tool or indicator or pattern signal is 100% guaranteed. This brings us to the point that there maybe be fake trend reversal signals in the market which may mislead us. The best result in technical analysis is always achieved when we combine two on more indicators. **In order to avoid fake trend reversal signals I will advise that you confirm the signal using a different technical analysis tool for example moving averages, stochastic parabolic sar, Ichimoku etc. I will confirm a trend reversal signal on a chart using the relative strength indicator (RSI) below.

Give a detailed explanation on the following Trend reversal identification and back up your explanation using the original chart. Do this for both bullish and bearish trends (Screenshots required).
a)Break of market structure.
b) Break of Trendline.
c) Divergence
d) Double top and Double bottom
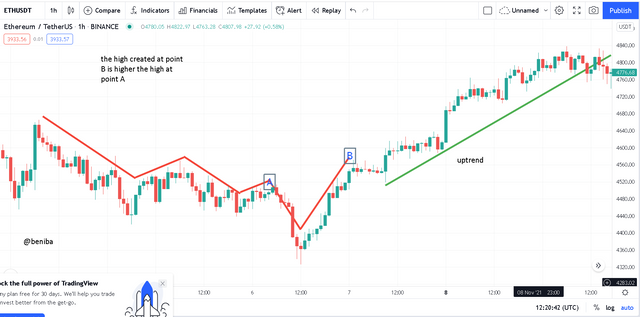
BREAK OF MARKET STRUCTURE (BULLISH TREND)
Seeing a bullish trend with the market structure we realize that it is not a smooth run of bullish candlesticks but there are price fall backs and retracement. For a bullish trend to continue the new lows created must be not be lower than the previous low.
For you to conclude that what you are seeing is a signal of a trend reversal then the new low or latest low that was created in the market must be lower than the previous low in the market. This indicated that a trend continuation is high unlikely to be witnessed and hence a trend reversal should be expected.
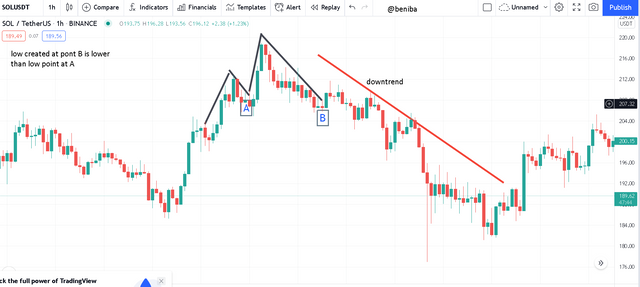
BREAK OF MARKET STRUCTURE (BEARISH TREND)
Just like identifying a bullish trend with the market structure the bearish trend is not always a smooth run of bearish candlesticks but there may be some price corrections even though the market stays in a bearish trend. New highs and lows are created. For a trend reversal to be identified then it means that the new high that is created goes higher than the previous high and this signals that buying pressure is gradually taking over and hence a trend reversal should be anticipated.
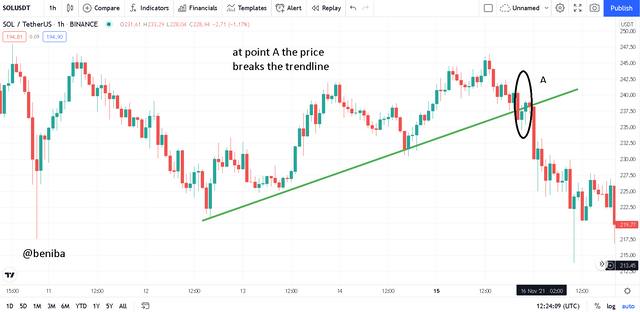
BREAK OF TRENDLINE (BULLISH TREND)
From previous lessons we know that trendlines are lines that drawn to join two low price points or two high price points on a chart that gives a clear view of the market trend. In a case of a bullish trend the trendline joins two low points. The trendline then acts as the support level of current market. Even though there maybe relapses in the bullish trend the new lows created are expected to always be above the trendline. When there is a breakout thus the price moves below the trendline thus it has broken the support level or zone then we say there is a trend reversal and the bearish trend begins from there.
BREAK OF TRENDLINE (BEARISH TREND)
Using a trendline to identify a bearish trend means that a line should be drawn to join two high price point of the market. This trendline acts as a resistance level or zone of the current market. A trend reversal is spotted with the trendline when the prices breaks or goes above the trendline acting as the resistance level. This indicates that buying pressure is now ruling the market and that marks the beginning of a bullish trend.
DIVERGENCE (BULLISH TREND)
In order to get a trend reversal signal you will need to add a technical indicator to your chart. The divergence is gotten by comparing the movement of the indicator to that of the price action on the chart. When at the same point the actually do not depict the same thing then a divergence has occurred. During a bearish trend when makes a lower low in the chart but the indicator depicts a high low then we should know that a bullish trend is setting in.
DIVERGENCE (BEARISH TREND)
Im sure we are now aware that an indicator needs to be added to the chart before divergence will be spotted. For you to identify that bullish trend is been reversed into a bearish trend then it means that; at a particular point the price action created a higher high whilst the indicator depicts a lower high. This means bears are taking over the market.
DOUBLE TOP
This is a price pattern formed during a bullish trend. This pattern can be used to determine whether a trend will continue or a trend reversal will occur. Just similar to the market structure trend reversal. During an uptrend when there is a retracement a the new high created happens to be lower than the previous high. It means that sellers are taking over the market and a bearish trend is expected.
DOUBLE BOTTOM
This is a price pattern formed during a bearish trend. This pattern can also be used to know whether a trend will continue or a trend reversal should be expected. Just like the market structure trend reversal. During a downtrend there is a retracement and the new low created happens to be higher than the previous low. It means that buyers are taking over the market and a bullish trend is expected.
place a demo trade using any crypto trading platform and enter a buy or sell position using any of the above mentioned trend reversal/continuation pattern.
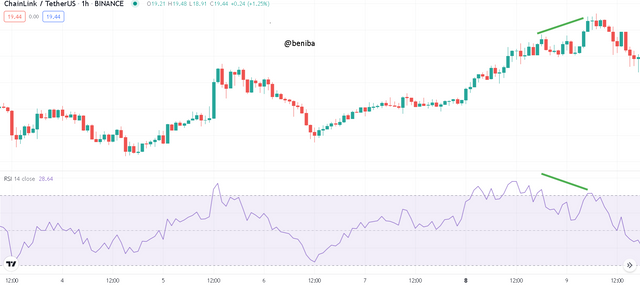
I spotted a trend reversal on the LINK/USDT chart using a trend line. From the chart shown you will see that at point A the market breaks through the resistance offered by the trend line indicating a trend reversal.
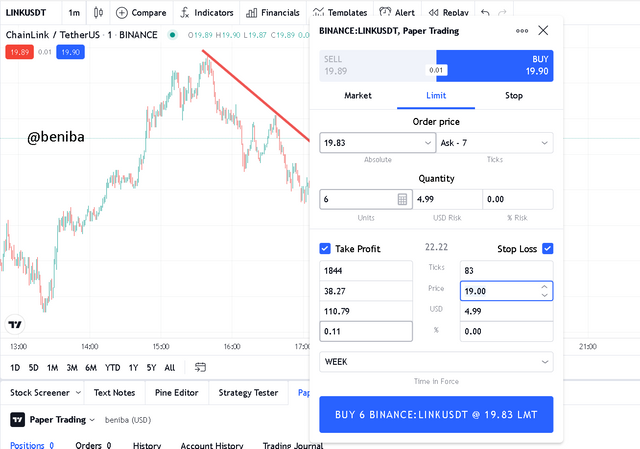
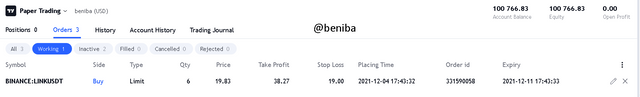
i filed a buy order to buy 6 units of link.
It cannot be overemphasized the importance of trends in crypto trading. Understanding and interpreting trends are very key to a successful trade. Spotting trend reversals In the market makes your timing of trades accurate and most at times you are seen taking profit. You can spot trend reversals through a variety of ways.
Hello @beniba , I’m glad you participated in the 3rd week Season 5 of the Beginner’s class at the Steemit Crypto Academy. Your grades in this task are as follows:
Observations:
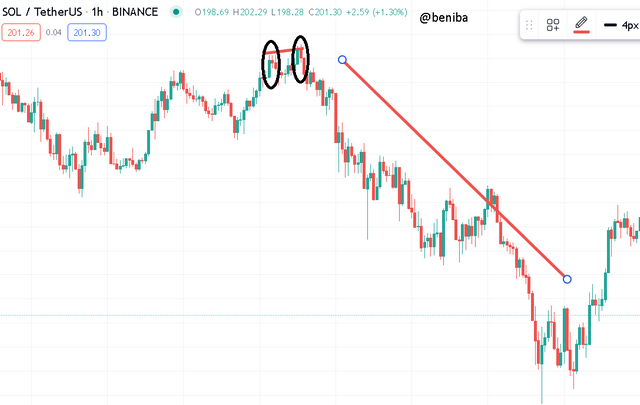
The image you provided for question 3 did not show the trend reversal.
Also, proof read your work before posting.
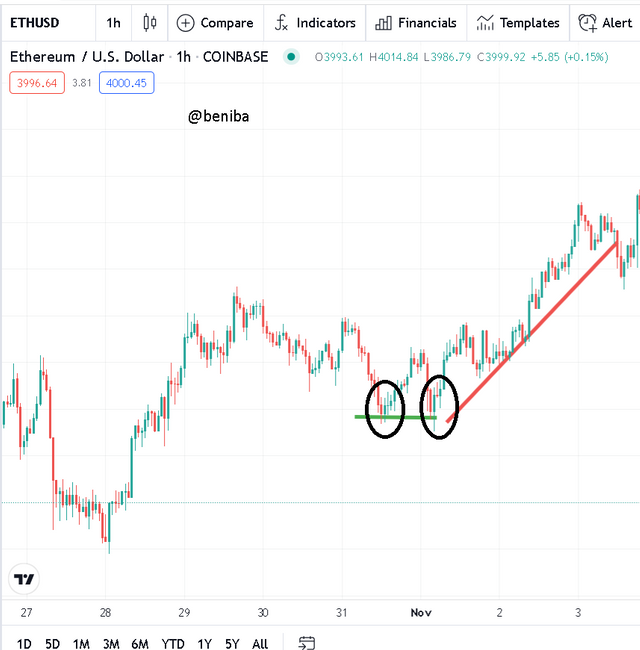
The image for Break of Bearish Trendline was not uploaded properly.
Recommendation / Feedback:
Thank you for submitting your homework task.