[ Highly Profitable Trading Strategy with VuManChu Cipher B ]-Steemit Crypto Academy | S5W6 | Homework Post for professor @reddileep

Question 1
Define VuManChu Cipher B Indicator in your own words.
VuManChu Cipher B Indicator
The VuManChu Cipher B is a technical-based indicator used in the technical analysis of crypto assets which is comprised of multiple indicators fused together to create a highly profitable trading strategy. The VuManChu Cipher B has is made up of indicators like relative strength index (RSI), Market volume and Momentum, Money flow, etc. The VuManChu Cipher B indicator was created from the market cipher B indicator with modifications made. The indicator is available for use via a public library script created by VuManChu, and it's also available for free on the Tradingview platform.
VuManChu Cipher B is used by traders to identify the current trend using the wave trends, areas of volume flow (inflow and outflow) using the money flow index. These combination helps traders to identify profitable trade signals. Though the indicator is considered to be advanced because of its many oscillating lines, it's quite readable and easy to understand.
The VuManChu Cipher B indicator works by representing the cumulative volume flow (inflow and outflow) with two lines, which oscillates within the wave trend of the asset. The wave trend has a dot system (red and green) indicator which is generated after a crossover indicating the side of the market in control of price, where the green represents the buyer and the red represents the seller.
Following the above principles, the VuManChu Cipher B indicator can confirm the directional movement of price with the developing price action. This correlates with the principles of demand and supply, where buying pressure creates demand, which forces the price of the asset to increase, and selling pressure creates excess supply, which forces the price of the asset to decline.

Question 2
How to customize the VuManChu Cipher B Indicator according to our requirements? (Screenshots required)
Customizing the VuManChu Cipher B Indicator
To customize the VuManChu Cipher B indicator, visit any price chart platform that supports the use of indicators. For this illustration, I chose Tradingview.
First, visit Tradingview's official website and access the chart section of the platform.
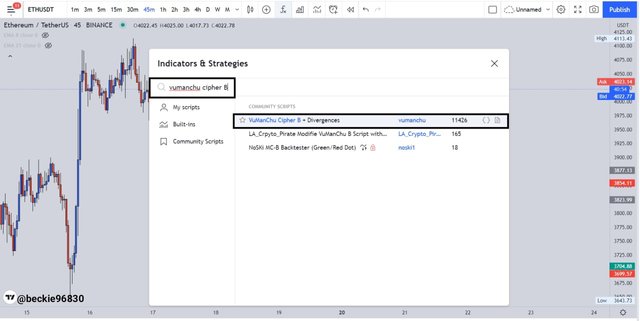
Next, click on indicators or Fx at the top center menu.
Next, search for the VuManChu Cipher B indicator using any relevant keyword like VuManChu, etc.
Then click on the indicator search result to add the VuManChu Cipher B indicator to the price chart.
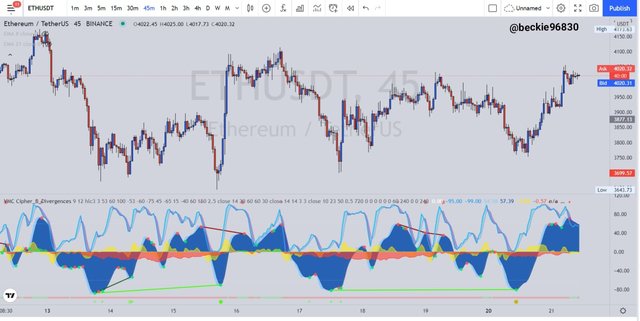
The VuManChu Cipher B indicator has been added to the price chart.
VuManChu Cipher B Indicator Settings
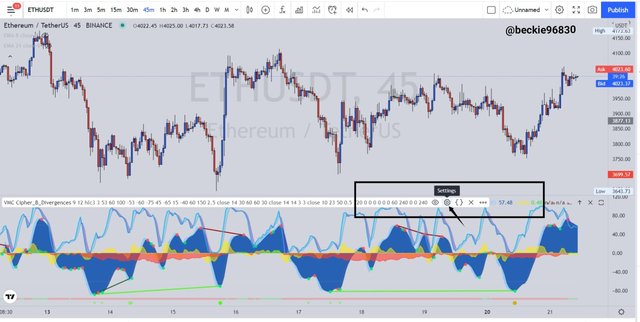
To configure the VuManChu Cipher B indicator, hover on the indicator name on the upper part of the indicator section and click on settings.
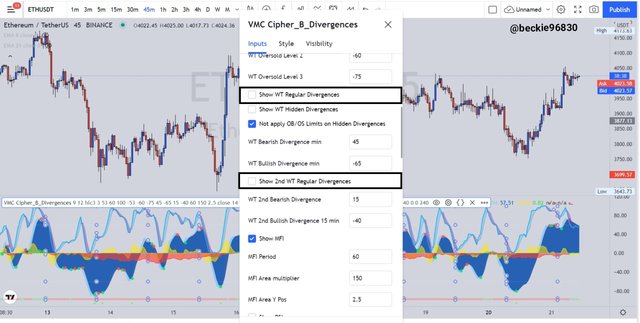
1- Inputs Tab
On the appeared inputs tab, some of the indicator parameters have to be removed to have a simple, less clustered indicator. First, scroll down and uncheck the Show WT Regular Divergences" and "Show 2nd WT Regular Divergences boxes. This is because the trading strategy taught by the professor doesn't use divergences but other trading strategies can utilize the WT Regular Divergence.
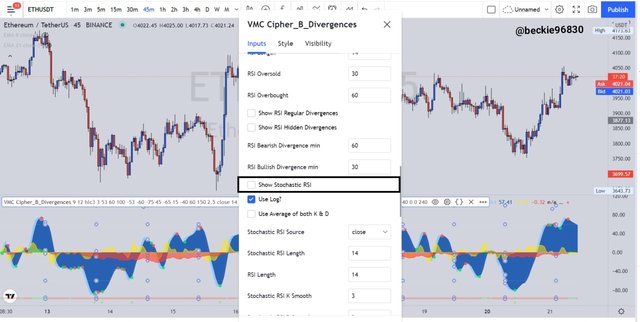
Next, scroll down again and uncheckthe Show Stochastic RSI box, which is irrelevant to this trading strategy being used.
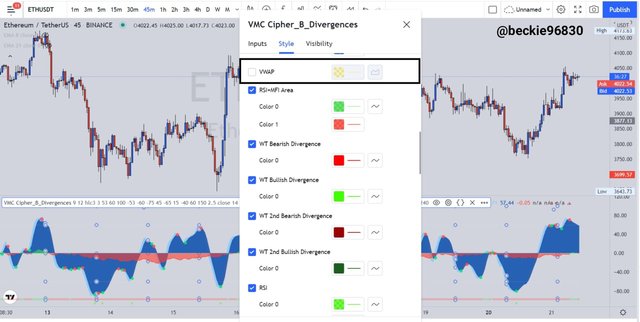
2- Style Tab
On the Style tab, the VuManChu Cipher indicator curve color, thickness, and precision can be configured. First, find and uncheck the VWAP box on this menu. The VMAP is a volume-weighted indicator, that calculates and displays the weight average price. This indicator is irrelevant to this trading strategy being used.
The next configuration on the Style tab is to remove the MFI Bar Colors indicator. This is a variant of the money flow index which highlights volume inflow and outflow with different colors bars. This indicator is irrelevant to this trading strategy being used.
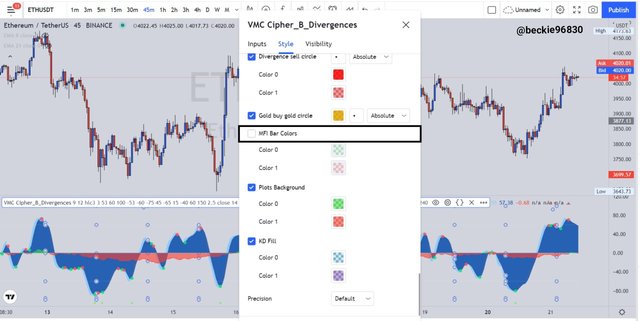
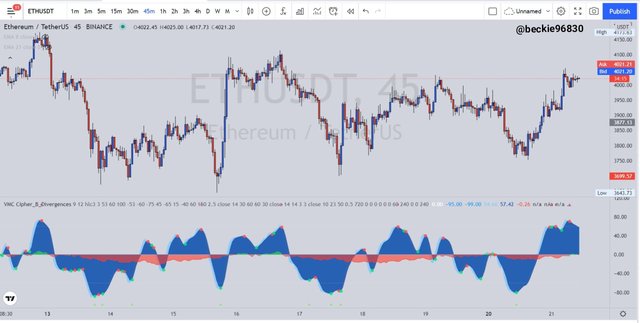
After the configuration, a clean, less cluttered version of the VuManChu Cipher B indicator is seen on the chart, showing the volume flow and the wave trend lines.
Question 3
Explain the appearance of the VuManChu Cipher B Indicator through screenshots. (You should Highlight each important part of this indicator by explaining their purpose)
VuManChu Cipher B indicator Appearance
As previously explained, the VuManChu Cipher B indicator is comprised of multiple indicators fused together to create the trading system. To better understand the indicator, one has 5o understand the various parts that make it up. I will describe the various parts of the indicator below:
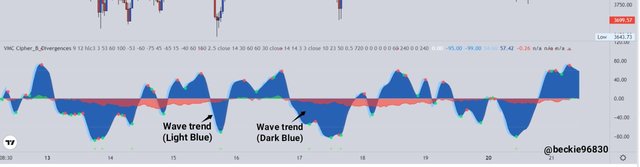
Wave Trend Indicator
The wave trend indicator is the blue filled line, that oscillates within the indicator bound, forming the base of the indicator. The wave trend is comprised of the two-tone blue line, which is the Light blue line and the dark blue line.
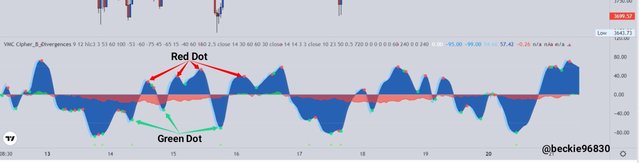
As observed, the blue line crossing is indicated with dots (either red or green) indicating the side of the market in control of price.
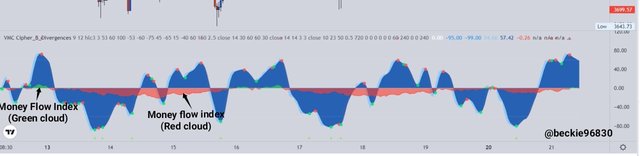
Money Flow Index Indicator
The money flow index refers to the cloud-like filled line within the wave trend that indicates the flow of capital in and out of the traded asset. It is represented with two colors (either red or green) where the green color indicates inflow of capital and the red color indicates outflow of capital.
Question 4
Demonstrate your preparation for the Trading Strategy by combining other indicators. (Instead of showing the addition of indicators to the chart, you should explain the purpose of each indicator for this trading strategy.)
VuManChu Cipher B indicator And EMA
The VuManChu Cipher B indicator is combined with exponential morning averages to filter out distorted or false signals generated by the indicator. This greatly improves the trade signal quality as multiple indicators confirm the trading bias. For this demonstration, the VuManChu Cipher B indicator will be combined with two exponential moving averages (EMA) with varying periods 55 and 200.
The EMA crossover is used to determine the trade signal, for instance, when the 55 EMA crosses above the 200 EMA, it is considered a buy trade signal, indicating that buyers are in control of price. Similarly, when the 200 EMA cross above the 55 EMA, it is considered a sell trade signal, indicating that sellers are in control of the price. With this point established, the EMAs can be combined with the VuManChu Cipher B indicator to identify possible trade signals.
It is important to note that the VuManChu Cipher B indicator must confirm the trade signal in line with the EMA crossover to consider it a good trade signal.
Question 5
Graphically explain how to use VuManChu Cipher B Indicator for Successful Trading. (Screenshots required)
Using VuManChu Cipher B indicator
As previously explained, using the EMA and the VuManChu Cipher B indicator require that the two separate indicators confirm the directional bias of price before confirming the trade signal is valid. I will illustrate this below:
1- Bullish Scenario
In a bullish scenario, the 55 EMA has to cross above the 200 EMA, this confirms the EMA bullish trade signal. With the condition satisfied, the VuManChu Cipher B indicator has to confirm the trade signal.
On the VuManChu Cipher B indicator, the volume flow (MFI) has to be green, indicating the inflow of capital to the asset, this follows the principles of demand and supply, as inflow creates demand, which in turn force the price of the asset to trade upwards.
Lastly, on the trend wave of the VuManChu Cipher B indicator, the crossover of the dark blue line and the light blue should be indicated with a green dot which signals that the current trend is bullish. This implies that buyers are in control of the price within the specified period. To illustrate this, consider the chart below:
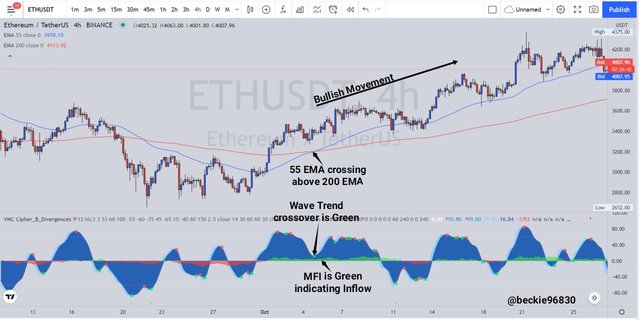
As observed, the EMA and the VuManChu Cipher B indicator both confirmed the bullish trend, satisfying every required condition. As seen, the money flow index was green, the wave trend crossover was indicated with green, the EMA crossed. This was followed by a bullish movement of price.
2- Bearish Scenario
In a bearish scenario, the 200 EMA has to cross above the 55 EMA, this confirms the EMA bearish trade signal. With the condition satisfied, the VuManChu Cipher B indicator has to confirm the trade signal.
On the VuManChu Cipher B indicator, the volume flow (MFI) has to be red, indicating the outflow of capital from the asset, this follows the principles of demand and supply, as outflow creates supply, which in turn force the price of the asset to trade downward.
Lastly, on the trend wave of the VuManChu Cipher B indicator, the crossover of the dark blue line and the light blue should be indicated with a red dot which signals that the current trend is bearish. This implies that sellers are in control of price within the specified period.
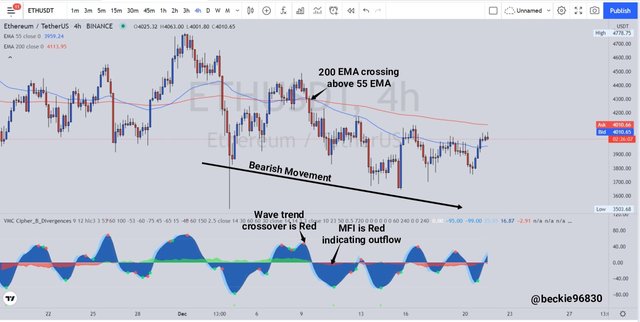
As observed, the EMA and the VuManChu Cipher B indicator both confirmed the bearish trend by satisfying every required condition. As seen, the money flow index was red, the wave trend crossover was indicated with red, the EMA crossed. This was followed by a bearish movement of price.
Question 6
Using the knowledge gained from previous lessons, do a better Technical Analysis combining this trading Strategy and make a real buy or sell order in a verified exchange. (You should demonstrate all the relevant details including entry point, exit point, resistance lines, support lines or any other trading pattern)
For this demonstration, I used Tradingview for technical analysis and binance exchange for trade execution.
Buy Trader XRPUSDT (5 MINS)
1- Tradingview Technical Analysis
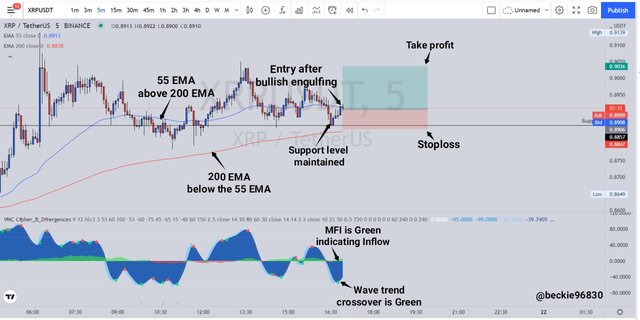
From XRPUSDT chart above, based on price action, the asset price maintained support at around $0.8855 level, which served as previous resistance. Following the trading strategy, the 55 EMA is above the 200 EMA which indicated that the current trend is bullish, and buyers are in control of the price.
The VuManChu Cipher B indicator confirms the trend with the money flow index (MFI) indicating that there is a short inflow of capital, as it is represented with a green color, this follows the principles of demand and supply, as inflow creates demand, which in turn force the price of the asset to trade upwards.
The wave trend crossover of the dark blue line and the light blue should be indicated with a green dot which signals that the current trend is bullish. This implies that buyers are in control of the price within the specified period.
2- Binance Trade Execution
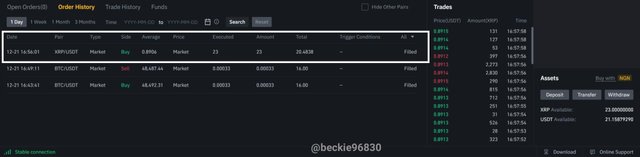
First, I accessed and logged into my verified binance exchange account. I executed the buy trade order.

The exchange buy trade position was executed at $0.8906 with stoploss at 0.8847 and take profit price at $0.9036. The trade has a risk to reward of 1: 2.5 with the Stoploss placed below maintained support level, and the take profit targeting the previous high points.
Conclusion
The VuManChu Cipher B has is made up of indicators like relative strength index (RSI), Market volume and Momentum, Money flow, etc. The VuManChu Cipher B indicator was created from the market cipher B indicator with modifications made. The VuManChu Cipher B indicator works by representing the cumulative volume flow (inflow and outflow) with two lines, which oscillates within the wave trend of the asset.
Thank you professor @reddileep for this educative and insightful lesson.