Crypto Academy / S4W2 - Homework Post for professor @kouba01 | Crypto Trading With Volume Indicator

Question 1
Explain the volume indicator in your own words.
The Volume Indicator
The volume indicator is a graphical technical indicator that represents the amount or quantity of a given asset traded within a specified time, usually expressed in currency value (USD, etc). The volume indicator data is generated from trading activities recorded by corresponding exchanges in form of exchange data feeds.
The volume indicator is represented with vertical rectangular bars of different sizes, located at the bottom section of a price chart, where each bar corresponds with the timeframe represented. Ideally, the size of the volume bar indicates the traded volume. For instance, a long bar indicated high trading activity, and a short bar indicated low trading activity.
Volume indicator represents price volume with two colors, which by default are the green and red colors. The green color indicates that the current trading volume is higher than the previously closed candle, in line with the corresponding timeframe. While a red color indicates that the current trading volume is lower than the previously closed candle, in line with the corresponding timeframe.
Volume Indicator is paired with other technical indicators to maximize trade setup potential, which enhances the trading experience.

Question 2
Use a platform other than Tradingview to present the volume indicator on a chart and show how to configure its parameters by justifying your choices. (Screenshot required)
Adding Volume Indicator to charts
To add volume indicator to a chart, visit any trading platform that supports the use of indicators. For this demonstration, I will use the Binance exchange platform.
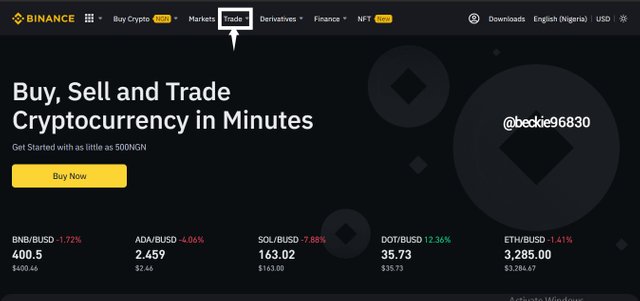
First, visit Binance official website and follow through with the login processes.
After login, on the homepage, click on the trade tab, choose advance to access the chart section of the platform.
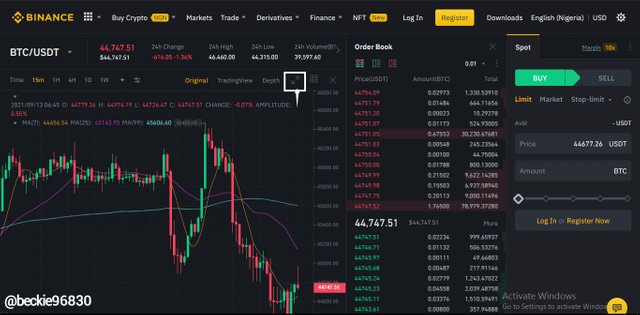
On the trade window, expand the chart view by clicking on the expansion icon on the chart section.
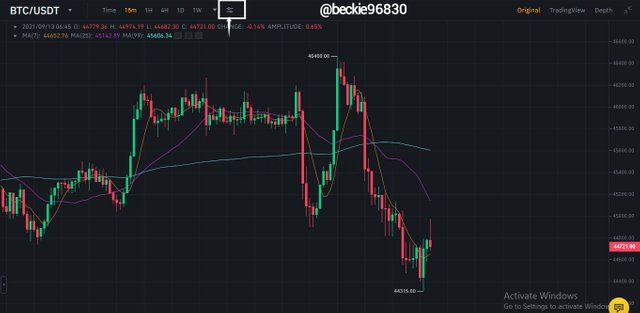
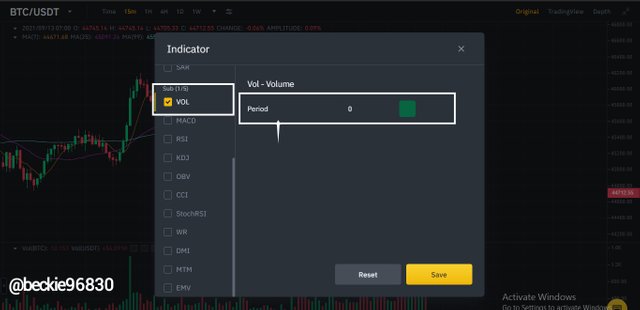
Next, on the expanded chart window, click on the indicator icon.
Next, on the indicator menu, move to the sub section and choose Vol
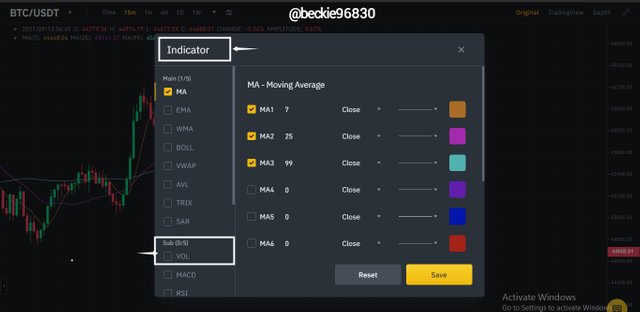
The Vol indicator can be configured to have an SMA on it, this is done by setting a period
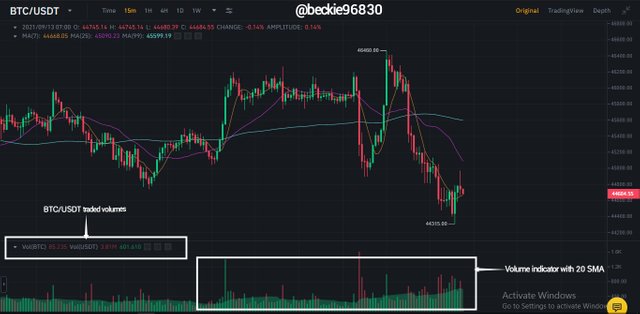
The volume indicator added to the chart, with an SMA period configuration of 20
Question 3
What is the link between Volume and Trend and How to use volume to predict a trend reversal? (Screenshot required)
Volume and Trend
The Volume indicator measure the buying and selling pressure of a given asset based on exchange transaction flow activities. This helps investors identify if the trend is backed by enough volume to continue in an established direction.
Investors use volume indicator in trading by comparing the volume of transactions recorded (volume indicator) on exchanges, with price movement to ascertain the strength of a trend. This helps investors to avoid weak trends and price fake-out moves.
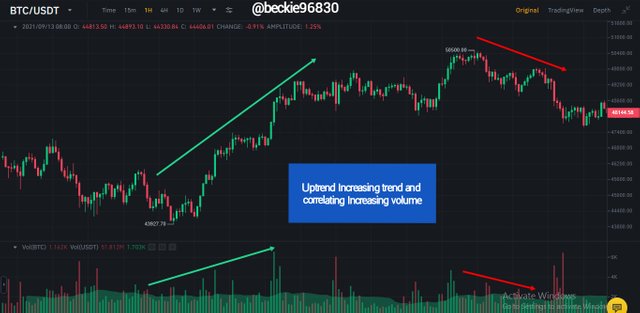
For instance, in an uptrend, the volume should be increasing when price is moving bullish, and volume should decrease when price is moving bearish.
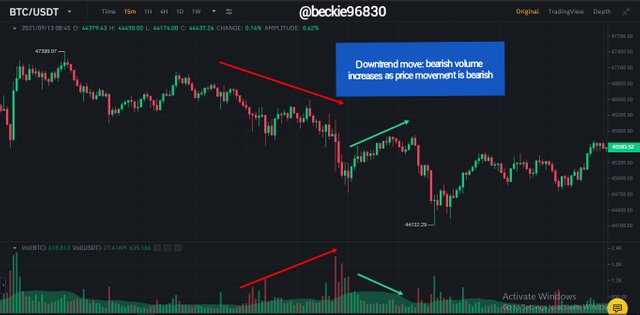
Similarly, in a downtrend, the volume should increase when price is bearish and decrease when price is bullish.
Volume and trend reversal
Trend reversal can be indicated by the volume indicator. This is seen when there is a divergence in the movement of price and the volume indicator, or when there is a consolidation structure in the volume indicator.
When price movement is bullish, and the volume indicator is decreasing, this implies that there is a limited presence of buyers in the market to support the bullish momentum. This causes a divergence structure between the volume indicator and price movement.
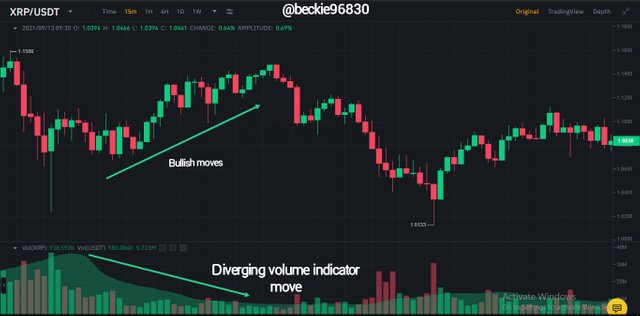
The XRPUSDT chart above shows a divergence in the movement of price and volume, where the price trend is bullish, but volume indicates fewer amount of buyers sustaining the buying pressure. This indicates a possible trend reversal as sellers are likely to come in and move prices lower.
Trend reversal can also be represented with the sideways movement of the volume indicator. The sideways movement indicates a complimenting ratio of buyers and sellers in an asset market.
Question 4
How to use the volume to have a signal confirmation? (Screenshot required)
Volume Indicator Trade signal
The volume indicator can be used for trade signal confirmation in multiple ways, some of which include trend momentum indication, the breakout at support and resistance levels, divergence of volume and price movement, etc.
1- Momentum indication
Volume indicator is used to confirm a trend because of its ability to show the strength of the trend (presence of buyers or sellers to support the established trend).
2- Breakout At Support or Resistance Level
A breakout move at a support or resistance that has a corresponding volume move shows the presence and willingness of either buyers or sellers to move price below or above the support or resistance level respectively.
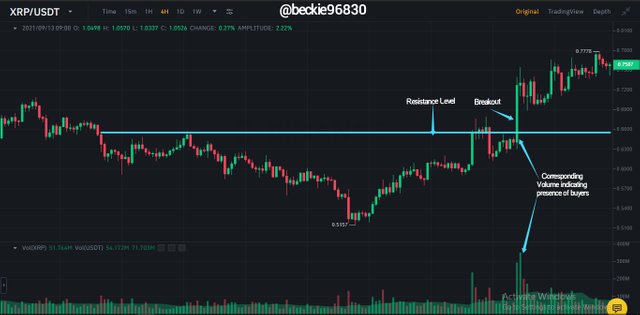
In the XRPUSDT chart above, price broke and closed above the resistance, signaling a buying opportunity, the volume indicator confirmed the signal with the high volume of buyers in the market to support the created buying pressure.
Question 5
How does the volume reflect the evolution of prices in the charts and why does the volume sometimes anticipate the price? (Screenshot required)
Volume and Price Evolution
Volume reflects the trend development of price by indicating the corresponding volume in the same direction of price movement. This supports the basis of the established trend, by showing the presence of active buying of selling pressure supporting the movement of price.
In an up-trending market, volume increases as price moves in an upward direction, this indicates that there is enough buying pressure to supporting the bullish movement of price. While the volume decreases as prices move in a counter-trend direction.
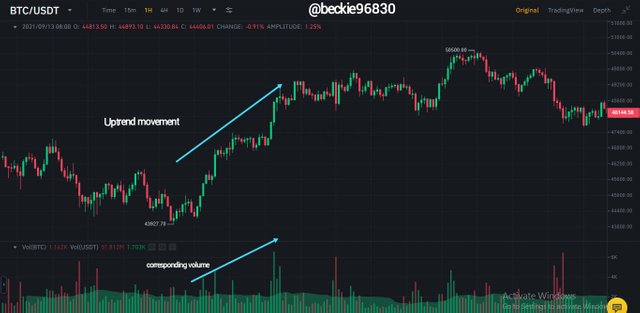
The BTCUSDT chart above describes how volume reflects price evolution by indicating the presence of buyers supporting the uptrend movement of price.
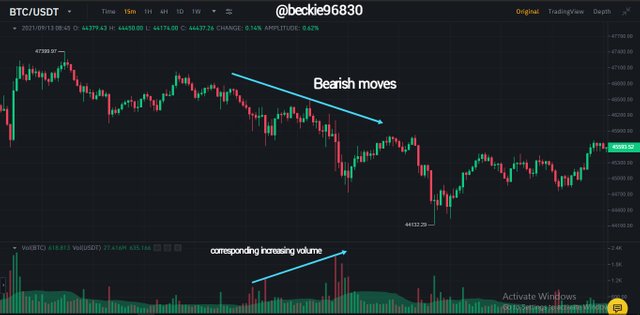
In a downtrend, price reflects price development through the indication of sellers supporting the downward movement of price.
Volume Anticipation of Price
Volume anticipates price movement because it represents the declining momentum of buying and selling pressure in trending markets before the actual trend reversal will occur. In an uptrend, the volume indicator will show a decline in traded volume while the price is still moving bullish.
Similarly, In a downtrend, the volume indicator will indicate a decline in traded volume while price is still moving bearish. The trend reversal will occur at later periods, thus confirming the volume anticipated move.
Question 6
Is it better to use the volume indicator alone or use it in parallel with another indicator when trading? Justify your answer
It is better to use the volume indicator in parallel with other technical indicators like moving averages, support and resistance levels, trendlines, price action, etc. to optimize trade entries and avoid fake-out moves.
Ideally, the volume indicator shows the volume of a given asset traded within a specified period. This implies that other exchange activities that don't necessarily move price can be represented on the volume indicator.
An example of this is an ICO of a token. This will increase the traded volume of the token without affecting actual price movements. This can be avoided by using other indicators to avoid price anticipation trap signals generated by the volume indicator.
Question 7
The volume indicators are multiple, choose one of them to briefly explain its usefulness in crypto trading.
Volume RSI Indicator
The volume RSI is a type of volume indicator that is similar to the RSI indicator but the difference is that the upbound and lower bound of the indicator is calculated from the volume of price movement.
The volume RSI generates trade signals that are calculated with the ratio of buying and selling price in a traded market. The Volume RSI has a bound scale between 0 - 100%, and a central level of 50%.
How Volume RSI is used In Trading
The volume RSI indicator signal is based on the 50% level, where a move from below the 50% line to above the 50% line is seen as a bullish signal, this indicates that the market's buying pressure outweighs the selling pressure. Similarly, when a move from above the 50% line to below the 50% line is a bearish signal, this implies that the market's selling pressure outweighs the buying pressure.
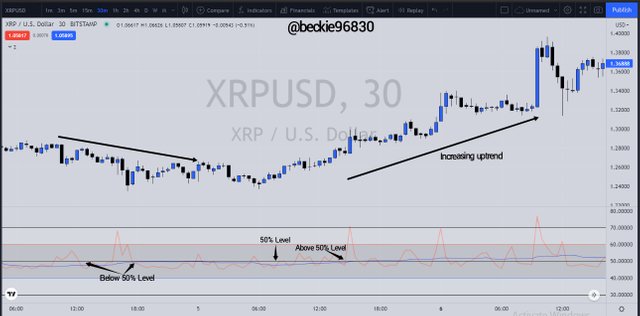
The XRPUSD chart above shows how the volume RSI indicator indicates the volume of buying and selling pressure, and how it can be used on trading to capitalize on quality trade setups.
Conclusion
The volume indicator is a good technical indicator that provides additional confirmation through the valuation of traded volume of an asset within a specified interval. These data help investors to properly understand the ratio of balance between price movement and exchange flow activities (traded volume).
The volume indicator should be used with other indicators to avoid price movement anticipation trap and fakeouts signals generated by the indicator, as it represents the overall volume of the asset traded.
Thank you professor @kouba01 for this insightful lesson.
Nice Explanation with chart examples.
Your presentation also good.
Keep going.
Great job!