Crypto Trading by Identifying Support and Resistance - Steemit Crypto Academy - S6W3 - Homework Post for @shemul21
Hello wonderful people, how are you today? I hope you're having a fantastic week. I'm ecstatic to be a part of this unforgettable lecture. In this article, I'll share my experience with Crypto Trading by Identifying Support and Resistance


1. What is the Support & Resistance zone?
Support Zone
The Support Zone is defined as the level in the marketplace where buyer demand is strong, which indicates that when prices test the Support Level, the market might go an upwards direction since buyers are engaged in the support zone.
When a price has tested a support zone loads of times and climbed upwards, it has located a support zone. As a result, we can forecast that whenever the price tests it once again, it will go upward.
We may put our purchase order at the Support Zone because buyer demand is great there, and we can take our purchase entry there.
Resistance Zone.
The resistance zone is defined as the level in the marketplace when seller demand is strong, which indicates that when the price tests the resistance level, the marketplace may move down since selling is aggressive in the resistance zone.
Once pricing has tested a resistance zone numerous times and gone down, it has found a resistance zone. As a result, we can forecast that when the price tests it again, it will go downward.
We may put our sell order or begin a short position at the Resistance Zone since selling pressure is great there, and we can grab our sell entry here anyway.
Explain different types of Support & resistance with proper demonstration.
There are several sorts of support and resistance that can assist traders in identifying market indications in a range of methods. I'll go through these different sorts of support and resistance here.
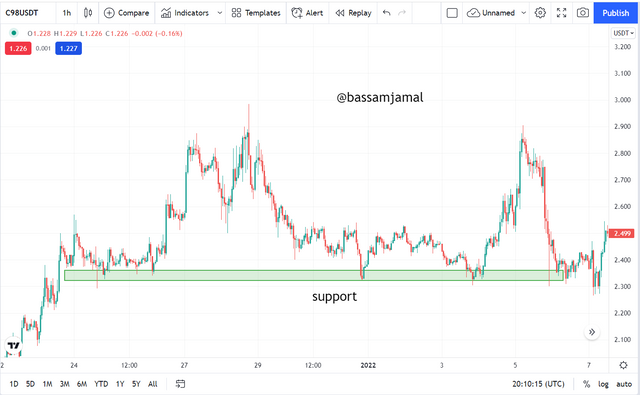
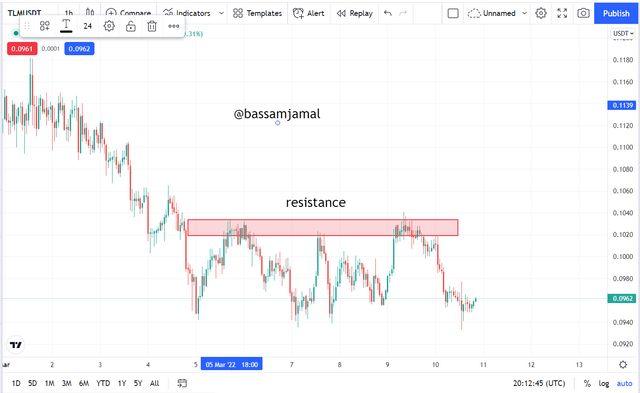
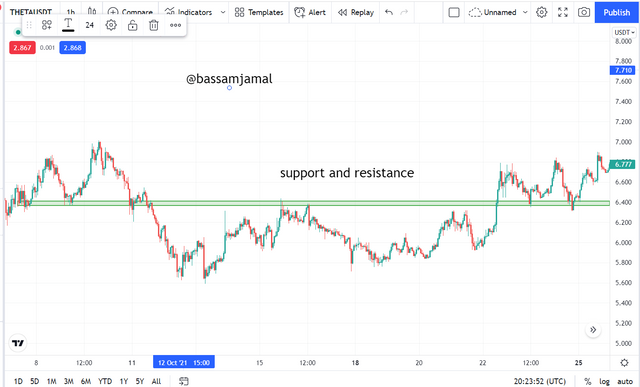
Horizontal Resistance and Support
Whenever the price tests support and resistance levels, horizontal and support levels operate as crisis point on the price graph, allowing us to readily foresee the outcome motion of the market.
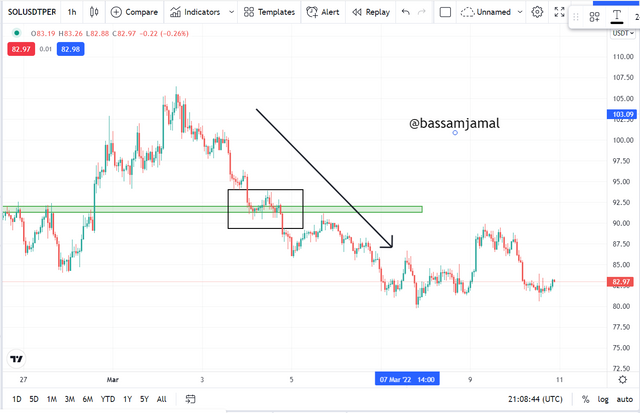
Whenever the price tests a resistance level numerous times and eventually breaks that point, that barrier can also operate as a support level for the price, and these levels are referred to as horizontal resistance and support levels.
Likewise, after trying support level numerous times, once price breaches support level, that level may also operate as a resistance level for the price.
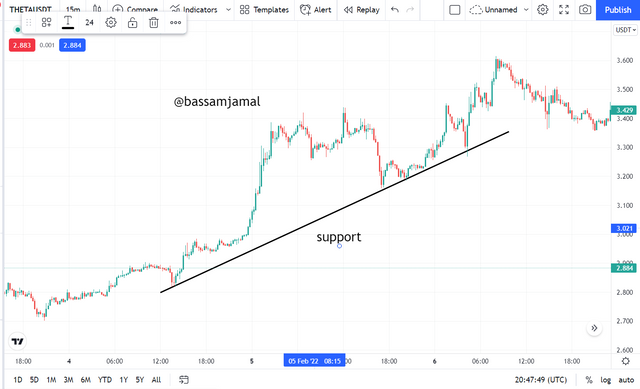
Diagonal Levels
Resistance and support points can also be visible on the graph as diagonals, which can be interpreted as trendlines. Let me go over the sloping levels in further depth.
Whenever the marketplace is in an upswing and price is constantly testing a given level and then continuing upward by establishing a sloping level, we may construct a trendline by which pricing has been checked several times.
That trendline can be seen as an uptrend. Support level because the overall trend acts as a support for the price.
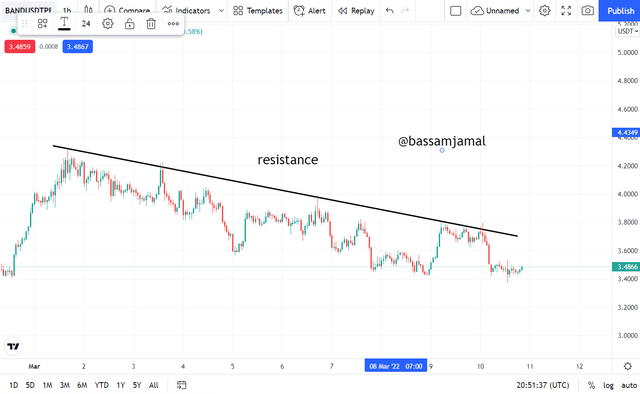
When the marketplace is in a decline and pricing is trying to test a given level and then sliding lower by creating a sloping level, we may construct a trendline through which it has been checked several times.
That trendline is indicative of a downward trend. Price is being held back by the trendline, which is functioning as a barrier.
Dynamic Levels
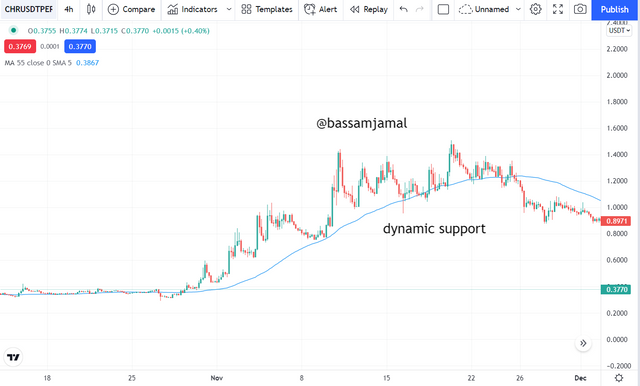
Dynamic Support and Resistance levels may be discovered by employing Moving Average Indicator lines, which can assist traders by predicting the next price turn.
We can detect market dynamic support levels. If the MA average lines are lower than the price, these might be regarded as dynamic support levels.
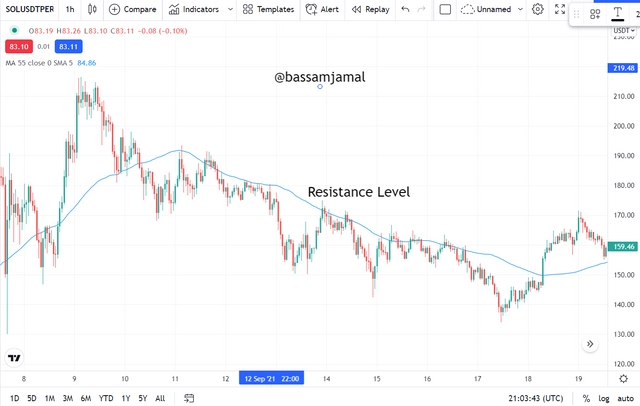
If the MA average lines are over the price, they might be regarded as dynamic resistance levels in the marketplace.
Identify The False & Successful Breakouts. (demonstrate with screenshots)
Breakouts in the market occur when pricing is able to breach a major level, which may be both a support and resistance level. In the marketplace, there are two sorts of breakouts: false breakouts and successful breakouts.
Successful breakouts may be classified into two types: continuation breakouts and reversal breakouts.
Continuation breakouts imply If the marketplace is in an upswing and the price has crossed a resistance level, this is termed as a continuation breakout since the price will continue to go upward after breaching the barrier level.
Likewise, if the marketplace is in a downturn and the price has breached a support level, this is termed as a continuation breakout since the price will continue to fall after breaching the support level.
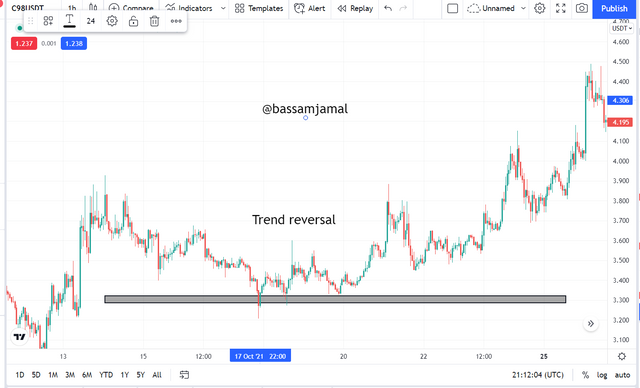
Reversal breakouts imply Whenever the marketplace is in an uptrend and the price breaches a support level, this is described as a reversal breakout because after breaching the support level, the price moves in the other way and the trend reverses.
Likewise, when the marketplace is in a downtrend and the price breaches a resistance level, this is known as a reversal breakout because after breaching the resistance level, the price moves upward direction and the trend reverses.
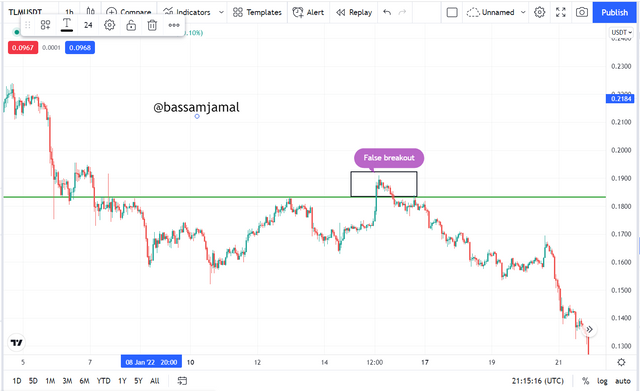
False breakouts occur when the price briefly breaches a critical level before reversing direction. It is frequently used by large corporations to catch minor dealers.
We can check out false breakthroughs by employing indicators like as MA and EMA, which assist validate the signal and so rule out misleading signals.
Use Volume and RSI Indicator Combined with Breakouts & Identify the Entry Point. (demonstrate with screenshots).
Other indicators, such as the Volume Indicator and the RSI Indicator, can also be used to find entryways utilising breakouts.
Volume is important in the market since it indicates price movements. If there is a surge in market volume, we can forecast our entrance point.
I will also utilize the RSI Indicator to pinpoint entry points utilizing Breakouts, and I will tell you about it. The RSI Indicator assists us in determining oversold and overbought areas. Whenever the RSI rises above 70, it indicates an overbought zone, and when it falls below 30 it indicates an oversold area.
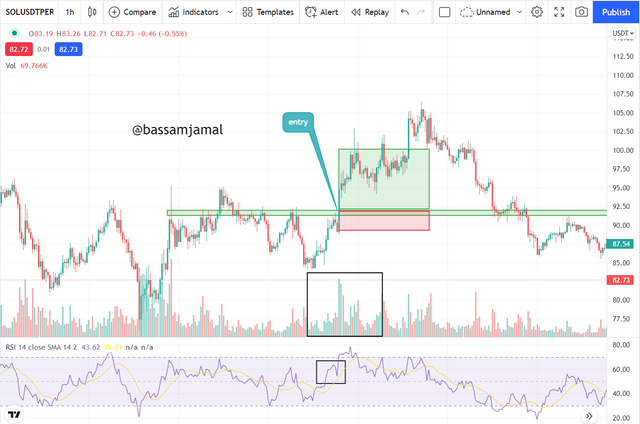
Buy Signal
First, I'll go through the entry position for a buy signal utilizing the Volume and RSI Indicators with Breakouts. Look at the image underneath.
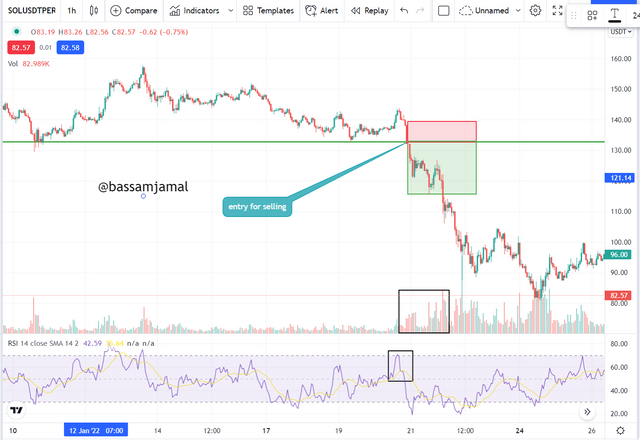
Sell Signal
I'll go through the point of entry for a sell signal utilizing the Volume and RSI Indicator with Breakouts. Look at the photo underneath.
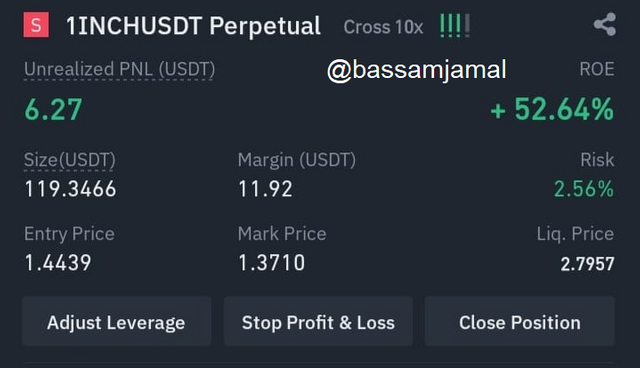
Take a Real Trade(crypto pair) on Your Account After a Successful Breakout. (transaction screenshot required).
In this section, I will use Resistance to execute a live trade on the 1INCHUSDT chart. I've included a screenshot of the chart below.
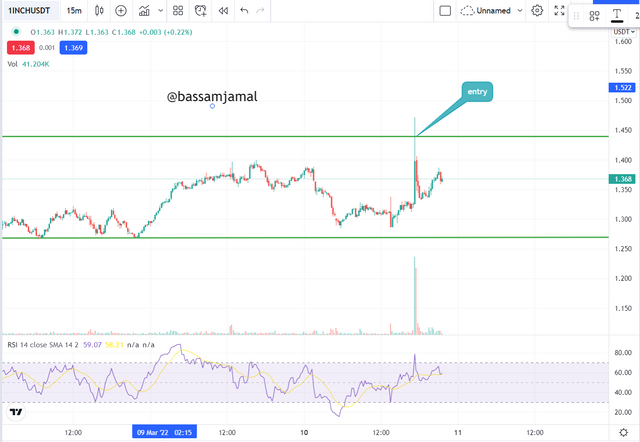
I expect that the price will test the resistance level based on the image. I examined the volume indicator and it is a bogus pump, which is corroborated by the 5-minute charts, which verify my entry point.
Explain the Limitations of Support & Resistance (false breakout).
We might also observe some misleading signals when we use these breakouts on Support and Resistance levels. Quite often the price breaches small support or resistance barrier but then closes up or down the level, which is known as a false breakout.
We can sift out these false breakouts by employing various indicators that can greatly assist traders in invalidating the signal. With it, we may utilize the RSI, MA, EMA, and Volume indicators.
Sometimes large institutions cause false breakouts by shifting the market slightly upwards or downwards, catching little traders.
Conclusion
It was an excellent presentation on Crypto Trading by detecting Support and Resistance levels. In this piece, I've covered everything there is to know about this subject.
Support and resistance levels are critical areas on the chart from which we may readily forecast market trend reversals.