Crypto Trading Strategy with Triangular Moving Average (TRIMA) Indicator - Crypto Academy / S6W4 - Homework Post for @fredquantum.
.png)
Hello everyone, How are you all doing?, I welcome you all once again to the Fourth week of the crypto academy season. This week, we will be focusing our studies on Cryptocurrency trading, where I get to explain to you how to trade with the help of a popular trading strategy known as the Trading Strategy with Triangular Moving Average (TRIMA) Indicator.
On today's, I will be submitting my task to professor @fredquantum, after I have studied and understood the Topic "Crypto Trading Strategy with Triangular Moving Average (TRIMA) Indicator", where I will explain to us how to identify entry and exit points with the TRIMA indicator, and as well give explanations to the basics studies in identifying an uptrend or downtrend with the TRIMA indicator, You can as well join me to study the course from the Page. WISH YOU A HAPPY READING!!!

TRIMA abbreviated for Triangular Moving average indicator is a trend based indicator that works similarly with most Moving average indicators, especially the Simple Moving Average indicator(SMA), the indicator is used to confirm the position of a trend, shows the current direction at which the market is traveling, and can be used to identify the dynamic support and resistance level on a market chart.
The TRIMA indicator depicts signals by calculating the simple moving average value of a market price in a pre-determined period, the indicator is used to locate or easily identify the current trend of the market in a case whereby the market is moving above the TRIMA signifies the market is in an uptrend, and when the market is moving below the TRIMA indicator signifies the market is in a downtrend.
The Uniqueness of the TRIMA indicator is that it doesn't react fastly as the other moving average indicators, which thus causes the indicator to be most effective in a highly volatile market, which thus allows traders to trade safely and avoid fake or false signals from the market. Lastly, the indicator also best works with other technical indicators when combined, indicators like RSI and MACD can best be used with the TRIMA for more effective use.
To set up a chart with the TRIMA indicator, I will be using the platform https://tradingview.com to show the illustration.
- Pick the crypto pair of your choice, then click on Indicator & Strategy[1], type In Triangular Moving Average indicator in the search box[2], then double click to have the indicator included on the chart.
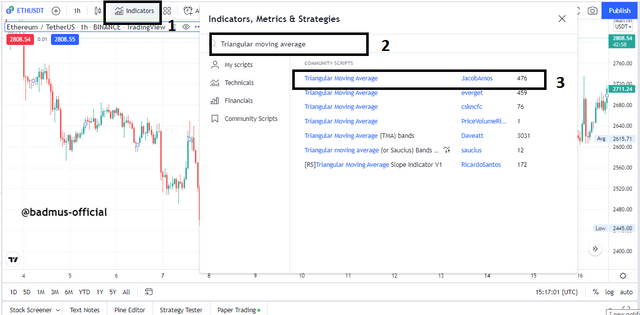
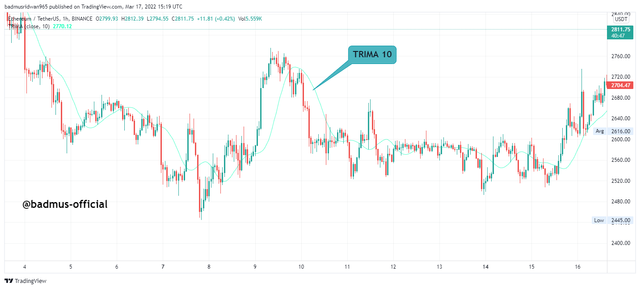
Now, you should have the indicator displayed on the chart with the default length of 10.
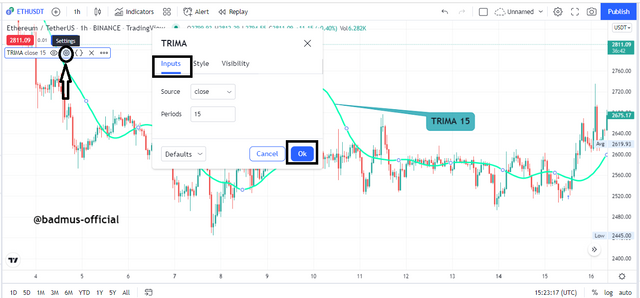
We can as well choose to pick the length we had prefer to work with by clicking on the indicator settings, Input and extending or reducing the length, in my case, I will be changing the TRIMA periods to 15, and also increasing the thickness of the indicator line.
TRIMA is the combination of Simple moving averages, whereby the calculation of TRIMA is based on the multiple values gotten from the SMA's in a predetermined timeframe, to get the TRIMA, we first need to calculate the SMA's.
So the SMA's calculation goes as;
SMA = (Price1 + Price2 + Price3 + Price4 + Price5 +Price6...+ P(last price of an asset in the period))/ (No. of periods).
Let's assume the following data;
Price1 = $40
Price2 = $42
Price3 = $39
Price4 = $46
Price5 = $36
Price6 = $47
Price (last period) = $50
In Seven days, i.e
SMA = ($40 + $42 + $39 +$46 +$36 +$47 + $50) / 7 days
SMA = ($300) / 7
SMA = $42.86, the SMA Price at the moment in a 7days period.
whereby after getting that, we can then input the values to get the TRIMA as it goes as ;
TRIMA = (SMA1 +SMA2+ SMA3+ SMA4+ SMA5+SMA6..+SMA(last number of SMA's)) / (No. of Periods)
SMA1 = $42.86
SMA2 = $44.10
SMA3 = $45.00
SMA4 = $43.50
SMA5 = $42.80
SMA6 = $40.56
SMA(last number) = $40.00
TRIMA = ($42.86 + $44.10 + $45.00 + $43.50 + $42.80 + $40.56 + $40.00) / 7
TRIMA = ($298.82 ) / 7
TRIMA = $42.69, the value of TRIMA in 7 days period
One major usefulness of technical indicators is to be able to identify uptrends and downtrend movements, to keep traders away from making the wrong entry.
To identify an uptrend movement with the TRIMA indicator, we must have to make sure we saw the TRIMA rising in a way that, the indicator is trending towards the market price, where in this case, we could see the market to be traveling above the TRIMA indicator, while the TRIMA will be making its movement below the market price.
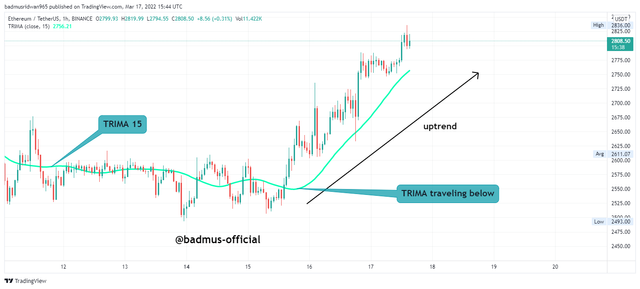
As can be seen from the image above is an uptrend market, as we could see that the market is traveling above the TRIMA indicator.
To identify a downtrend movement with the TRIMA indicator, we must have to make sure we saw the TRIMA indicator to be falling, wherein in this case, we could see the market to be traveling below the TRIMA indicator, while the TRIMA will be making its movement above the market price.
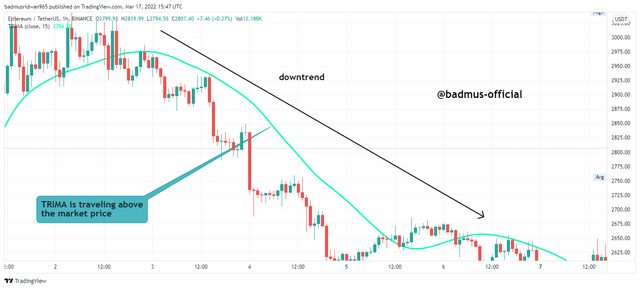
As can be seen from the image above is a downtrend market, we could see that the market is traveling below the TRIMA indicator.
One of the major attributes of the TRIMA indicator is that it could as well be used in locating the dynamic and support and resistance level.
The TRIMA is used in identifying the resistance level when the market rises to the TRIMA indicator and started falling making lower lows, as the market keep depicting lows, this is seen mostly in a downtrend market. In a case whereby the market breaks out the resistance level, it can be considered as a trend reversal or a new uptrend is likely to occur.
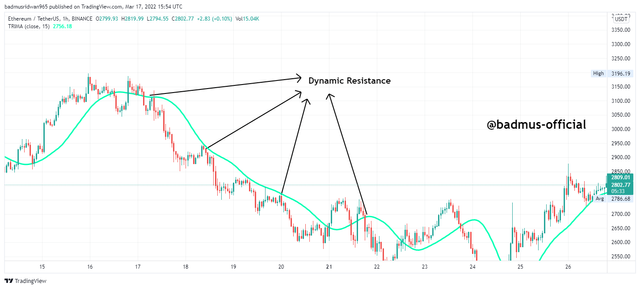
From the image, we could see how the market keeps dropping at the resistance level at the moment the market touches TRIMA.
The TRIMA indicator is as well used in identifying the support level when the market falls to the TRIMA indicator and started rising making higher highs, as the market keep depicting higher highs, this is seen mostly in an uptrend market. In a case whereby the market breaks out the support level and quits rising, it can be considered as a trend reversal or a new downtrend is likely to occur.
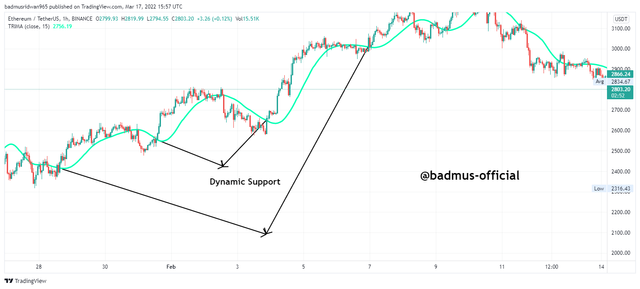
From the image, we could see how the market keeps rising at the support level at the moment the market touches TRIMA.
A market is said to be consolidating when it doesn't have a true direction, i.e, not an uptrend, and not a downtrend, in that case, small buyers and sellers are still dragging the market, and the market is likely to pick a new trend afterward.
The TRIMA indicator is used to identify a consolidating market when the indicator is moving between the market price, which is different from the case of the TRIMA indicator moving below(uptrend) or ahead(downtrend).
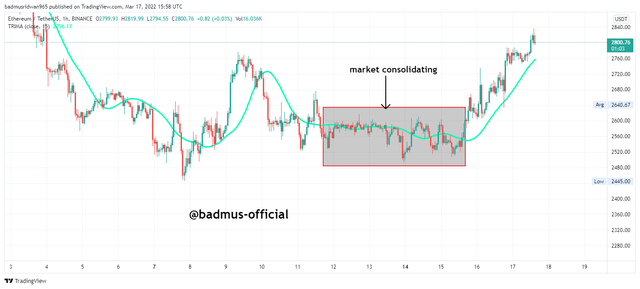
From the image, we could see the market to have no direction as the market ranges for a while before it eventually breaks bullish, and TRIMA went below to eventually travel under the market price.
With the help of combining two short lengths of TRIMA's indicator, we get to confluence our entry whereby these get to tell us how valid the entry is and gives confirmation to the current signal.
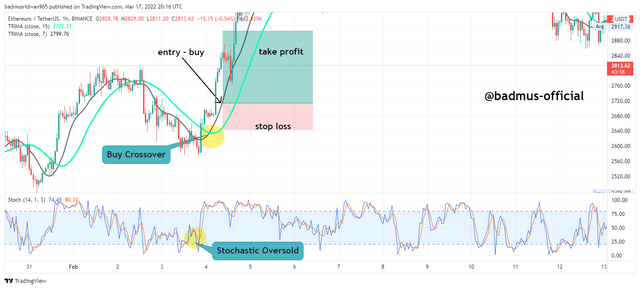
For this case, I will be combining the period lengths of 15 and 7 on the chart ETHUSDT to confirm my entry and exit strategy.
Buy Signal - Crossover - We get to utilize a buy entry when we witness the short length TRIMA to have crossed over the Long length TRIMA to the top, which in that case, they are now both traveling below the market price till they eventually cross to a new movement.
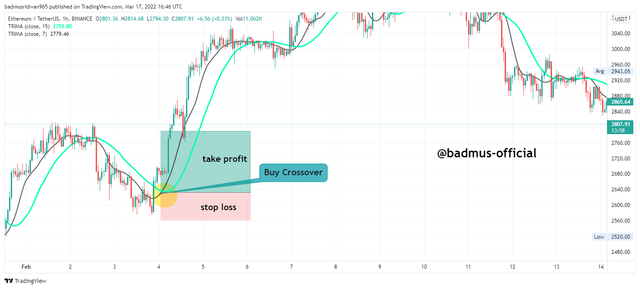
As seen from the image above, I open a buy position when the TRIMA's crosses the market to below, and the two lengths TRIMA's are now traveling under the market price, I set my stop loss just below my entry in case the market moves otherwise.
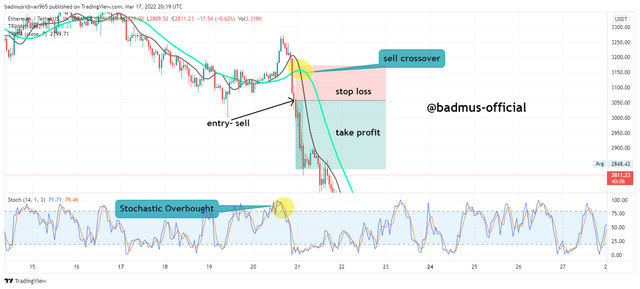
Sell Signal - Crossover - We get to utilize a sell order when we witness the short length TRIMA to have crossed over the Long length TRIMA to the bottom, which in that case, they are now both traveling above the market price till they eventually cross to a new market movement.
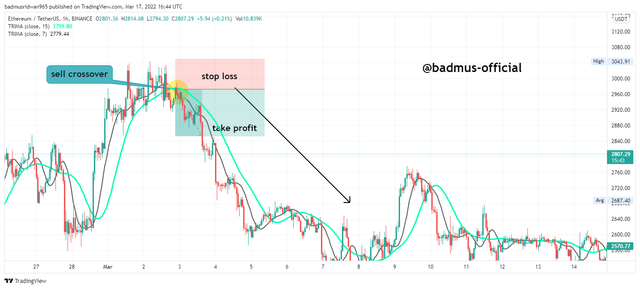
From the image above, I open sell position when the TRIMA's crosses and the two lengths TRIMA's are now traveling above the market price, I set my stop loss above my entry in case the market moves otherwise.
There are several conditions to be met before we carry on a trade using the Triangular moving average indicator strategy, I will be listing points of the criteria that are supposed to be met with before traders carry on with the buy or sell trade.
For this strategy, we combined the Relative strength indicator (RSI) to strengthen our signal entry, as we know that the market shows overbought when it got to the Upper band ( 70) line of the RSI, and the market portrays an oversold signal when the market reaches the lower band (30) line.
BUY TRADE - Criteria:
- We combined two TRIMA indicators on the market chart, preferably two short-length TRIMA in a short-term trade, and we as well add the RSI Indicator to the chart.
We must confirm there is now a reversal from the downtrend market as the market is expected to have hit the oversold region of the RSI.
We ensure that the Short Length TRIMA must have crossed the Long Length TRIMA to the top, after these conditions are confirmed, we patiently wait for two or more candlesticks before placing our entry to BUY.
After confirming our entry, we set the risk management, the stop loss is to be placed below the support level at the point the market crosses over, a risk-reward of 1:1 or 1:2 is best utilized with this strategy.
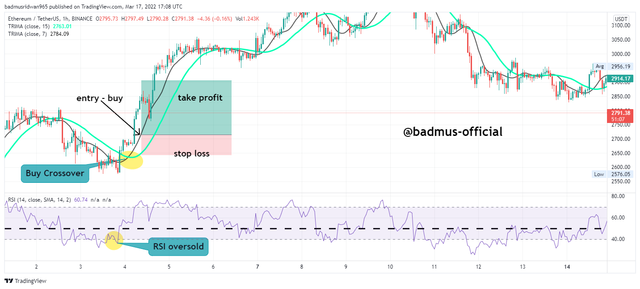
As can be seen from the image above that the four criteria are met as I have placed my entry three candles above the crossover, and the Short TRIMA has crossed the Long Length TRIMA.
SELL TRADE - Criteria:
- We combined two TRIMA indicators on the market chart, preferably two short-length TRIMA in a short-term trade, and we as well add the RSI Indicator to the chart.
We must confirm there is now a reversal from the uptrend market as the market is expected to have hit the overbought region of the RSI.
We ensure that the Short Length TRIMA must have crossed the Long Length TRIMA to the bottom, after these conditions are confirmed, we patiently wait for two or more candlesticks to have depicted below before placing our entry to sell.
After confirming our entry, we set the risk management. the stop loss is to be placed above the resistance level at the point the market crosses over to the bottom, a risk-reward of 1:1 or 1:2 is best utilized with this strategy.
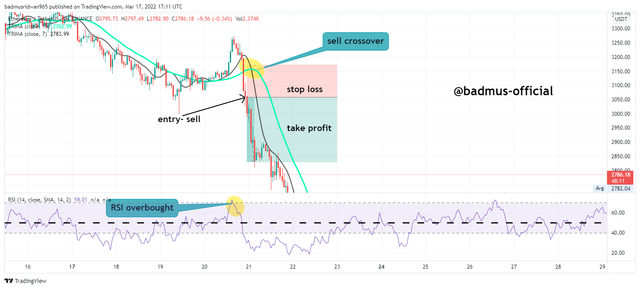
As can be seen from the image above that the four criteria are met as I have placed my entry to sell three candles below the sell crossover, and the Short TRIMA has crossed the Long Length TRIMA to the bottom as they are both traveling ahead of the market price.
The other indicator that can be used is the Stochastic oscillator Indicator which works similarly to the RSI, the stochastic display signal using the %k line and %D line, which the %K line is the fast-moving while the %D line is the Slow-moving line, when the %K line crosses %D line it signifies Bullish and vice versa.
The stochastic as well depicts an oversold signal when it crosses the Lower band (20) line and depicts an overbought region at the Upper Band (80) line.
Buy signal with Stochastic:
We can then use the Stochastic indicator to confirm the buy signal when we witness the market to be traveling ahead of the 20 line which is the Oversold region, this shows that there is a possible uptrend in the market. And we as well witness the %K line to have crossed the %D line.
Sell Signal with stochastic:
We can as well use the Stochastic indicator to confirm a sell signal when we witness the market to have crossed the overbought region, and the market is depicting a possible downtrend. And we as well witness the %D line to have crossed the %K Line.
I will be utilizing the Trading Strategy of the Triangular Moving Average indicator to carry out a sell trade on a demo account(Paper Trading) and as well carry a real Buy trade on Binance Futures.
After following the criteria of a sell signal explained earlier, I took an entry to sell the market of WAVESUSDT on a 5 Min chart frame.
I notice that the Short length TRIMA has crossed the Long Length TRIMA to the bottom, and the market is traveling below the TRIMA indicator.
I as well notices that the RSI had just finished at the Overbought Region, I waited for the market to cross for at least 3 candles, then I decided to sell with my risk-reward ratio in 1:1. I placed my stop loss above the resistance level.
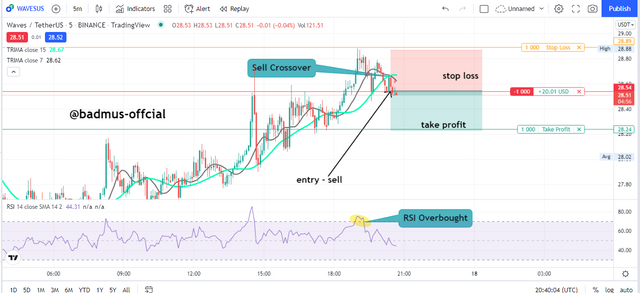
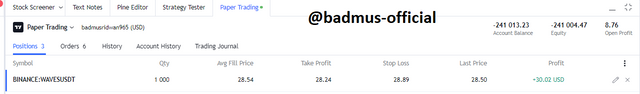
Some moment after my trade execution, the market is now moving in my prediction as I was now having a profit of +30USD on a 1000 purchase of the WAVES coin.
After following the criteria of a Buy signal explained earlier, I took an entry to buy the market of BCHUSDT on a Min chart frame.
I notice that the Short length TRIMA has crosses the Long Length TRIMA to the top, and the market is now traveling above the TRIMA indicator.
I as well notices that the RSI had just finished at the Oversold Region, I waited for the market cross for at least 3 candles, then I decided to buy with my risk-reward ratio in 1:1. I placed my stop loss below the support level.
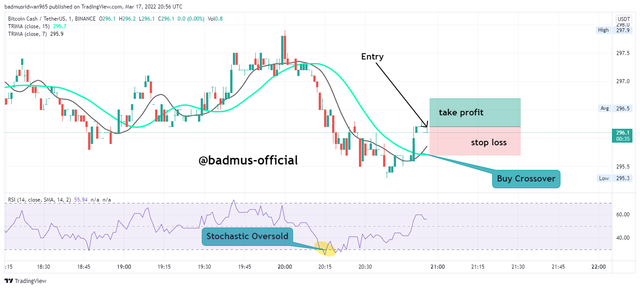
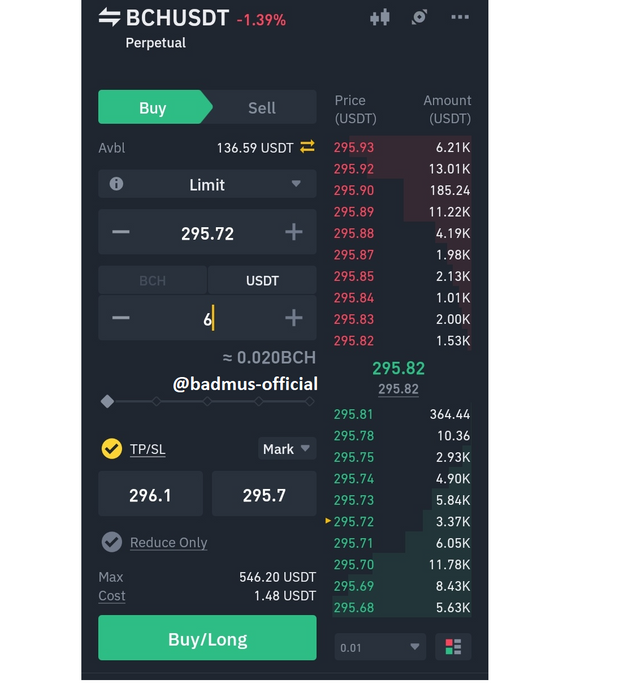
I took an entry to buy the BCH coin at the entry price of 295.82USD, then my stop loss at 295.7 and my profit level at 296.1USD.
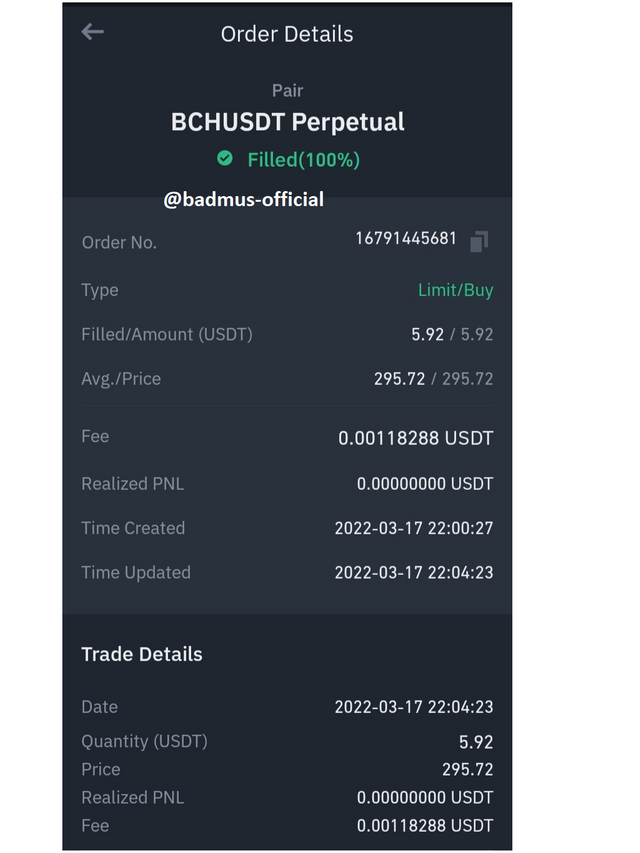
Proof of my running trade From Binance Futures.
Below, I will be listing the advantages and the disadvantages that came with the usage of the TRIMA indicator
Advanatages Of TRIMA indicator:
It is a trend-based indicator, meaning it can easily be used to know the current position of the market without any further market analysis.
It can easily be used to identify the current market trend as the Indicators work in a similar way same as the MAs.
It is a smoothed Indicator, meaning unnecessary signals are been filtered, and the indicator doesn't react quickly to market action.
The indicator crosses over can be used as a perfect entry tool for traders.
The Indicator can also be used in identifying the dynamic support and resistance level which these levels can be used in predicting the next market movement.
- The indicator can be best used with other momentum indicators such as RSI, stochastic, and others as a confluence trading strategy.
Disadvantages of the TRIMA Indicator
The TRIMA indicator has the same faults as the other moving average indicators as they react slowly to market signal, in a case that the market trend would have gone before the indicator eventually reacted to the trend.
Gives false signals sometimes which is why the indicator can't be independently depended on.
Can not be used as a standalone strategy as it sometimes over filter signal, which is why we add other momentum indicators such as RSI, MACD, and others.
Here comes my conclusion on the topic "Trading Strategy with the Triangular Moving Average Indicator" in which I have explained the basic knowledge one needs to have acquired before getting to use the indicator.
The TRIMA indicator is a moving indicator as the indicator tends to give a smooth signal due to its level of filtering bad market signals and insignificant market data.
The TRIMA indicator is best used with other technical indicators like the RSI indicator and others, as the indicator can't be used as a standalone due to over smoothed causing the indicator to give late or false signal times.
Special mention to professor @fredquantum for a well-detailed description, I hope to see you in the next class.
Steemit Cryptography students: