Crypto Trading with Moving Average -Steemit Crypto Academy | S6W2 | Homework Post for @shemul21
This is a very informative lecture for those who are attached to trading. In this lecture, the professor explains the Moving Average indicator and also elaborates on different types of Moving Average. We use the Moving Average indicator in trading to determine the current trend in the market. Now, I try to explain the Moving Average Indicator in my own word. I hope, I will do justice with this topic.

Explain Your Understanding of Moving Average.
As we know, there are several technical analyses tools available in the market for determining technical analysis and predicting the suitable entry and exit zones. The Moving Average is also a technical analysis tool that is one of them. It is used to perform technical analysis and determine the market trend. The Moving Average is one the most widely used indicators among all the traders of the word.
The Moving Average is a Trend-based indicator that is basically used to determine the current trend in the market. We can easily determine the current and previous market direction with the help of the Moving Average Indicator. The Moving Average indicator allows us to spot and identify the bearish or bullish reversal in the market.
The Moving Average is showing the Average price of assets over a certain period of time. We use the Moving Average with different parameter lengths. The results are changed after changing the parameters of the indicator. Large Scale parameters like 100-200 are mostly used in my long-term trading and short scale parameters like 9-55 are mostly used by short-term or intraday traders.
When the price action is above the line of the Moving Average indicator then we can say that the market is on an uptrend and buyers are more in control than sellers. On contrary, when the price action is below the Moving Average then, it indicates that the sellers are in control and the market is on a downtrend. We can easily determine the buy and sell signals using the Moving Average Indicator.
What Are the Different Types of Moving Average? Differentiate Between Them.
There are different types of Moving Average Indicators available in the market. They show a little bit different results due to changes in calculation strategy. Here will discuss three different types of Moving Average indicators. They have different calculation strategies but they show altogether same result. All these indicators are used by different types of traders.
1. Simple Moving Average (SMA)
Simple Moving Average is a very simple Indicator among all the Moving Average indicators. It shows the result in the form of a dynamic line after calculating the average price over a certain period of time. It just adds the closing price of all the candles and divides them by the number of candles that are going to select. In this way, traders get an idea about the average price of assets. Traders predict the future movement of the market using the moving average
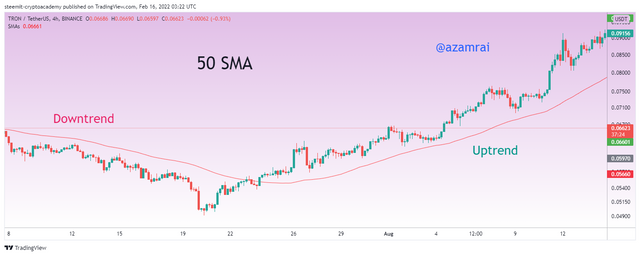
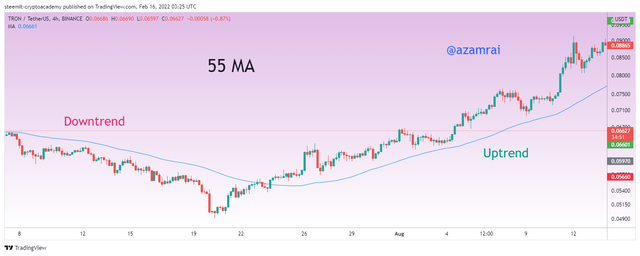
In the above figure, you can see that the Moving Average is applied on the chart. I apply 55 Day moving Average on the chart. It is recommended to use Fibonacci numbers as period length. You can see that the moving average is moving under and above the chart. When MA is above the chart it indicates the downtrend in the market, and when it lies under the price action it shows the uptrend in the market.
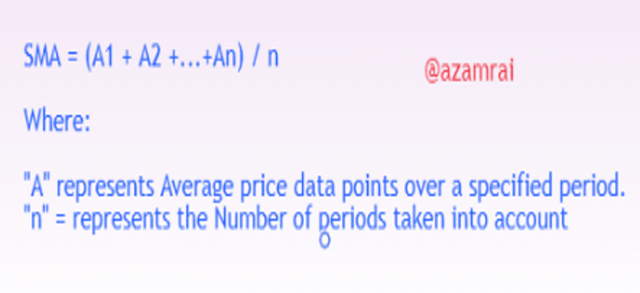
In the above figure, you can see the calculation formula of the Moving Average. In this formula, the price of all candles is considered, and add these price values and divide by the number of candles that we input as period length. It results in the form of the dynamic line that fluctuation when a certain time period candle is closed.
We will understand this formula and calculation by putting values into it. After putting the values and calculation, we get the result of simply moving. In this, we have every period value over a 9-period length. Let's see in the following example.
A1 = $12, A2 = $15, A3 = $11, A4 = $20, A5 = $18
n = 9
SMA = (A 1 + A 2 + A 3 +A4 +A5 )
SMA = (12+15+11+20+18)/9
SMA = 76/5

2. Exponential Moving Average (EMA)
Exponential Moving Average is also an indicator that is used in trading for doing technical analysis. Exponential Moving Average is an advanced version of the Moving Average. It reduces the delay that is present in the moving average indicator. Reducing the lag in Moving Average makes the moving average to Exponential Moving Average.
Due to reducing the delay in producing the current result, traders use the EMA for short-term trading. Using the EMA indicator, traders get trading signals quickly and traders made decisions on time. Traders use the MA and the EMA as a conjunction to perform both long and short-term trading.
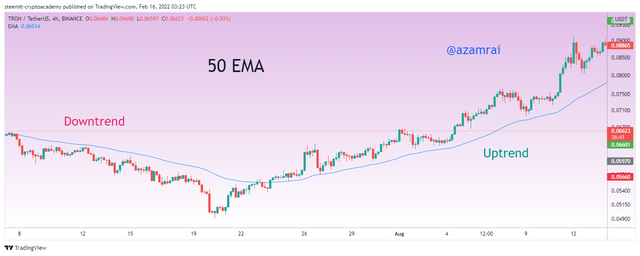
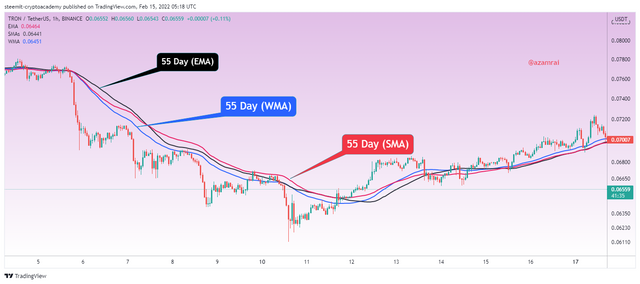
In the above figure, you can see the EMA is applied on the chart. In this, I apply the same 55-period length. When EMA is above the price action, it indicates the downtrend in the market, and when it lies under the price action it shows the uptrend in the market.
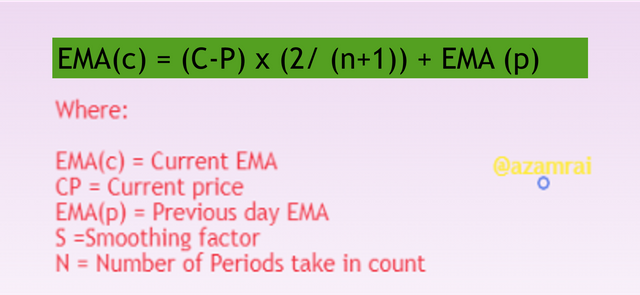
The formula behind the EMA indicator is to consider the previous period EMA, Current price, Smoothening factor, and the number of periods that we want to set. In the above figure, you can see the formula of EMA. All the parameters are defined in the above figure.
We will better understand the EMA formula and calculation by putting values into it. After putting the values and calculation, we get the result of EMA. In this, we need to get the Current price, Previous period EMA, and period value over a 9-period length. Let's see in the following example. We assume the following values.
Current Price = $4.32
EMAp = $4.21
n = 9
EMA = (Current Price - EMAp) x (2 / (n + 1)) + EMAp
EMA = (4.32 – 4.21) x (2 / (9 + 1)) + 4.21
EMA = (0.11) x (2/10) + 4.21
EMA = (0.11 x 0.2) + $40
EMA = 0.022 +4.21
3. Weighted Moving Average (WMA)
Weighted Moving Average is also an indicator that is used in trading for doing technical analysis. Weighted Moving Average is designed in a way in which it reacts quickly and shows results immediately after observing the current price. Weighted MA is focused on the recent price data about the current candle in order to calculate the WMA.
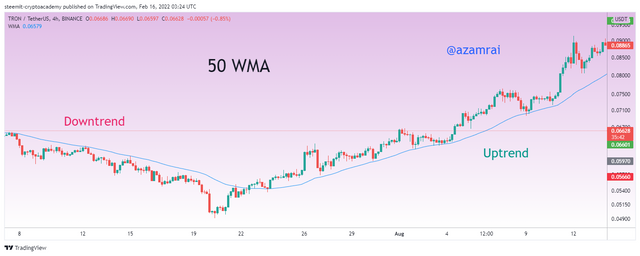
Due to its quick-reacting nature, it is moving close to the price. It moves side by side with price action with holder few distances. The distance between the price action and the EMA is short with respect to another MA indictor. When WMA is above the price action, it indicates the downtrend in the market, and when it lies under the price action it shows the uptrend in the market.
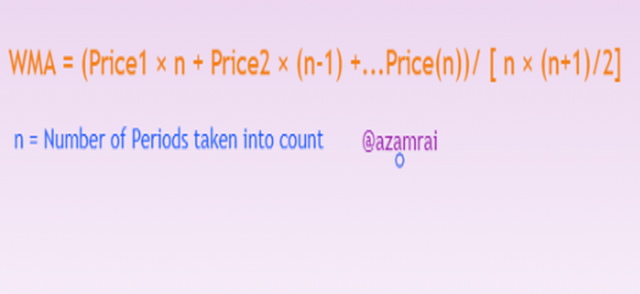
The formula behind the WMA indicator is to consider the current price and the number of periods that we want to set. In the above figure, you can see the formula of WMA. All the parameters are defined in the above figure.
We will better understand the WMA formula and calculation by putting values into it. After putting the values and calculation, we get the result of WMA. In this, we need to need the price values for every period equal to our period length, Previous period EMA, and period value over 9-period length. Let's see in the following example. We assume the following values.
P1= 3
P2=4
P3=5
P4=4
P5=3
P6 =2
n = 6
Now according to the formula, we put all the values into it.
WMA = (3 x 6) + (4 x (6-1)) + (5 x (6-2)) + (4 x (6-4)) (3 x (6-5)) (2 x (6-6)) /6(6+1)/2
WMA = (18 + 20 + 20+ 8 + 3)/42/2
WMA = 69/21
4. Triple Exponential Moving Average (TEMA)
Triple Exponential Moving Average is designed after merging the three Exponential Moving Average indicators. In this, we first, determine the EMA over a certain period of time, and in the second EMA, we take EMA of EMA1 over the period length that we apply in EMA. Next in the third EMA, we take the EMA of EMA2 with the same parameters.
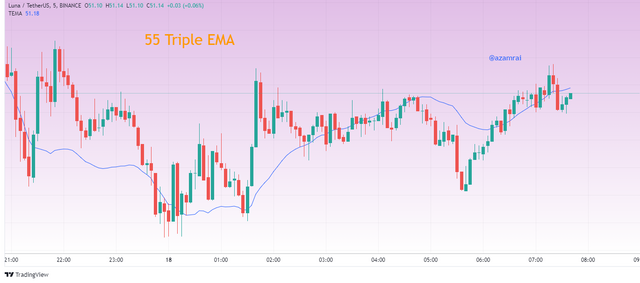
It is basically created to remove the lag that is present in other MA. It is mostly used in short term or swing trading because it produced quick trading signals. In the following figure, you can see the TEMA is applied on the chart.
TEMA = (3 x EMA ) + 3 ( EMA of EMA1) – (EMA of EMA2))
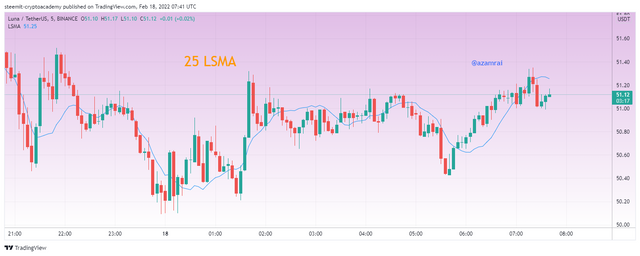
5. Leased Squire Moving Average (WMA)
The Leased Squire Moving Average is a trend-based Indicator that is used to get information about the current trends in the market. We get the signals of uptrend and downtrend after observing the placement of Leased Squire Moving Average. We use this indicator to get the buy and sell signal from the market. The difference between the other indicators and this indicator is the calculation behind the indicator. It uses the least squire value of the particular asset. In the following figure, you can see that the LSMA is applied on the chart. We can use LSMA for both short and long-term trading.
Difference between the Simple, Exponential and Weighted Moving Averages
| SMA | EMA | WMA |
|---|---|---|
| It is showing the Average price of an asset over a certain period of time | It is an advanced version of the moving average | It is more sensitive to price action and shows the quick result |
| It shows more precise results when the value is high | It shows more precise results, when EMA value is low | It works better even on both high and low values because it bounds closely to recent price |
| It considers the closing price of all candles and the number of periods to calculate the Moving Average | It considers the previous period EMA, Current price, Smoothening factor, and the number of periods to calculate the EMA | It only considers current price and number of periods for calculation |
| SMA produce delay and show the result after a while | EMA produce fast result than SMA | WMA is more sensitive than both SMA and EMA when we talk about small price |
| Simple Moving Average is suitable for long-term trading style | It suitable for short-term trading | It is more sensitive to price and show quick results that is why it suitable for scalp trading |
)
Identify Entry and Exit Points Using Moving Average. (Demonstrate with Screenshots)
The moving average is a widely used indicator by traders. Traders get entry and exit signals from the moving average. I use usually two moving averages as a conjunction in order to get entry and exit signals from the market. To get the entry and exit signal, I use two different moving averages with different parameters. Now, we will see how trading positions are determined by these indicators.
I am found of more precise and confirmed entry and exit signals from the market. So, that is why I use two moving averages. As I mentioned in the above question that the SMA is suitable for long-term trading and EMA is used for short-term trading. I use SMA with large period and EMA with small period length.
Entry Signal
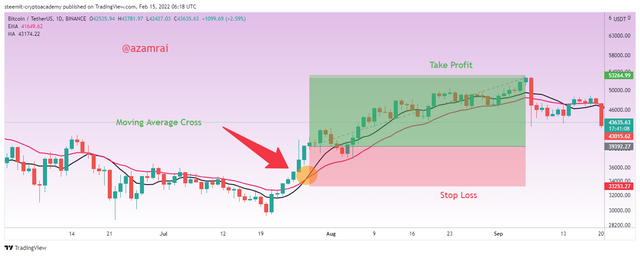
To get the Entry signal from the market, I use 50 periods SMA and 21 periods EMA. The market is on an uptrend and both SMA and EMA are under the price action in this scenario if the market breaks the EMA and the test takes the support of 50 SMA then it is a confirmation signal of the uptrend. It is a good buying opportunity for us.
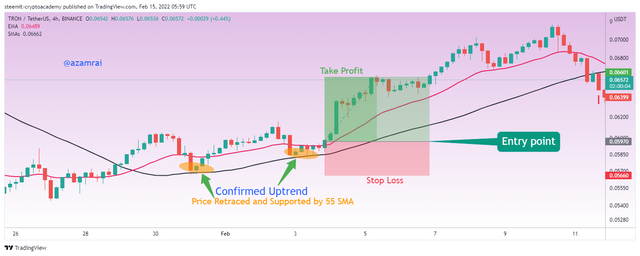
In the above figure, you can see that the market is on an uptrend because both indicators are under the price action. The market tests the 50 SMA two times. When the market tests the 50 SMA a second time, then it is confirmed the uptrend signal and at the same time, I place a buy order when after taking support of SMA. You can see that the price is on the way to an uptrend. We should take an entry with proper risk management. Stop and Take profit is also applied. Risk Reward ratio is 2.
Exit Signal
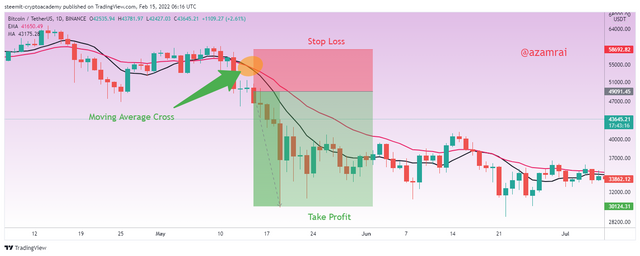
To get the Exit signal from the market, I also use 50 periods SMA and 21 periods EMA. If the market is on a downtrend and both SMA and EMA are above the price action in this scenario the market breaks the EMA to an upward direction and is resisted by 50 SMA, then it is a confirmation signal of a downtrend. It is a good exit opportunity for us.
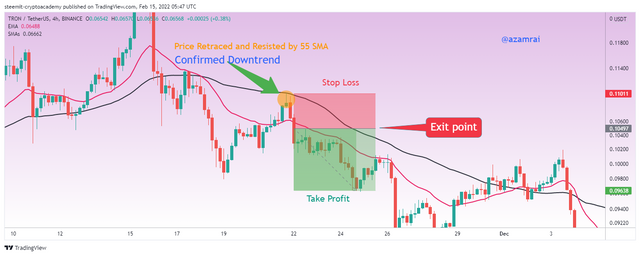
In the above figure, you can see that the market is on a downtrend because both indicators are above the price action. The market is resisted by 50 SMA. When the market is resisted by the 50 SMA, then it is confirmed downtrend signal and at the same time, I place a sell order when after taking resistance of SMA. You can see that the price is on the way to a downtrend. We should take and exit with proper risk management. Stop and Take profit is also applied. Risk Reward ratio is 2.
What do you understand by Crossover? Explain in Your Own Words.
The moving average is a widely used indicator all over the world. Entry and exit signals are taken from the market using one or more moving average indicators. Traders usually use two moving averages as a conjunction in order to get entry and exit signals by using different parameters.
Traders use two indicators, one with a large period length and the second with a small period. Different signals are produced by the indicators when they make a cross. By observing the nature of the cross, traders make trading decisions.
The moving average with a lower period length reacts faster and travels with price action maintaining the small distance. It produces quick results. On contrary, the moving average with a higher period length reacts slower than small MA and travels with price action maintaining a distance greater than small MA.
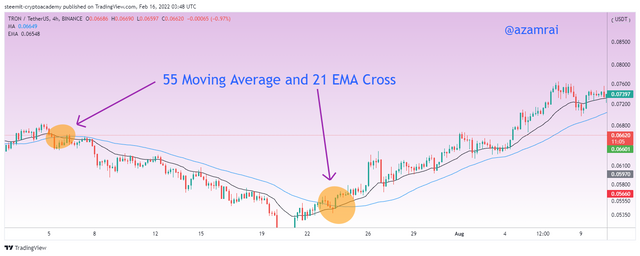
When the higher MA is crossed the lower MA from top to bottom, it indicates that the current bearish trend is about to end and a new uptrend is going to start. This cross serves as buying opportunity for us. Most traders use these crosses to take an entry to the market.
When the higher MA is crossed the lower MA from bottom to upward direction, it indicates that the current bullish trend is about to end and a new downtrend is going to start. This cross serves as a selling opportunity for us. Most traders use these crosses to take benefit in a bearish market.
These crosses are working only in the trending market. When the market is moving in sideways, these crosses do not work. So, we need to be very careful while doing trading with the crosses. We should also perform risk management while doing trading. In this way, we perform trading safely.
Explain The Limitations of Moving Average.
There are many advantages of the moving average. At the same, there are several disadvantages of moving average. Although it is a widely used indicator all over the world it does not mean that it is a hundred percent sure indicator. As we know, the indicators that display current values on the basis of previous data are commonly produced false signals.
- The Moving Average indicator is produced the current result on the basis of previous data, which is why it shows false signals sometimes.
- It produced late trading signals that lead us to lose the on-time trading position.
- It takes only the price of the asset to calculate the current moving average, that is why sometimes, it shows wrong results.
- The moving average is not working in a ranging market. It is only working in the trending markets.
- The moving average with a short period length can lead us in the wrong direction due to the quick responsive nature with price action.
- There are no rules for selecting the particular time period for a particular type of trading. Traders who are not familiar with using the period length are not taking enough benefit from the market.
The Moving Average is basically used to determine the current trend in the market. We can easily determine the current and previous market direction with the help of the Moving Average Indicator. It shows the result in the form of a dynamic line after calculating the average price over a certain period of time.
Exponential Moving Average is an advanced version of the Moving Average. It reduces the delay that is present in the moving average indicator. Weighted MA is focused on the recent price data about the current candle in order to calculate the WMA.
When the higher MA is crossed the lower MA from top to bottom, it indicates that the current bearish trend is about to end and a new uptrend is going to start. This cross serves as buying opportunity for us. Most traders use these crosses to take an entry to the market.
Cc:
Thank You, Professor: @shemul21
@kouba01
Submitted by: @azamrai