Steemit Crypto Academy Season 5 Week 3 [Beginner's Course] - Understanding Trends II
QUESTION 1 .
a) Explain your Understanding of Trend Reversal. What is the benefit of identifying reversal patterns in the Market?
b) How can a fake reversal signal be avoided in the market? (Screenshot needed)
a) Explain your Understanding of Trend Reversal. What is the benefit of identifying reversal patterns in the Market?
b) How can a fake reversal signal be avoided in the market? (Screenshot needed)
a) Explain your Understanding of Trend Reversal. What is the benefit of identifying reversal patterns in the Market?
Friends, the trend that happens in this market is your very best friend and those who follow the trend get a lot of profit.Without knowing the trends, you will not be able to walk in the market. If you do not follow the trend, then it will become a kind of speculation for you.
Before working in each market, it is very important for you to know about the trend . How do you identify it? This is much more important.
Before you trend identification, you should know what is a trend.
What is the meaning of trend, means the movement of the market and let us understand it in detail It means in which place the direction of the market is going, going up or coming down. It tells whatever the moment of the market is.
Trend are mainly of three types.
- Uptrend
- Downtrend
- Sideways trend
1.First of all, now we will know about the uptrend, what happens?
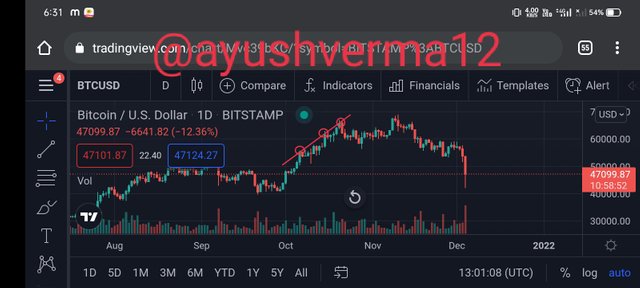
Whenever candles go up in the market making higher high end higher low , it means now trend.
In this time the demand becomes much more than the supply That's why the market remains bullish and at this time we get signals to buy in the market.
2.Now we understand the downtrend
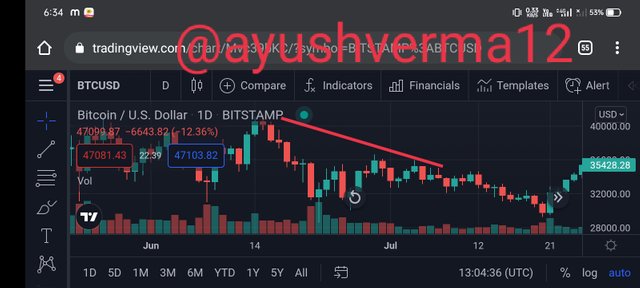
if the candles are making higher higher and lower low, if they are going down, then that time is called downtrend And in this time the supply becomes much more than the demand.
And at this time, there is a lot of falling order in the market, and the price at this time is also very likely to increase.
3.Now we finally understand the sideways trend.
When the candle is in the same circle in the market, on one side making High and on the other side making the low. Walk in the same way for a long time. You can also call it the consolidation period.And at this time the supply and demand are equal to each other.During this time we will get no buy signal and no supply signal. In this time, we should stay a little bit away from the market.
Let us now know that the trend of the advanced level.
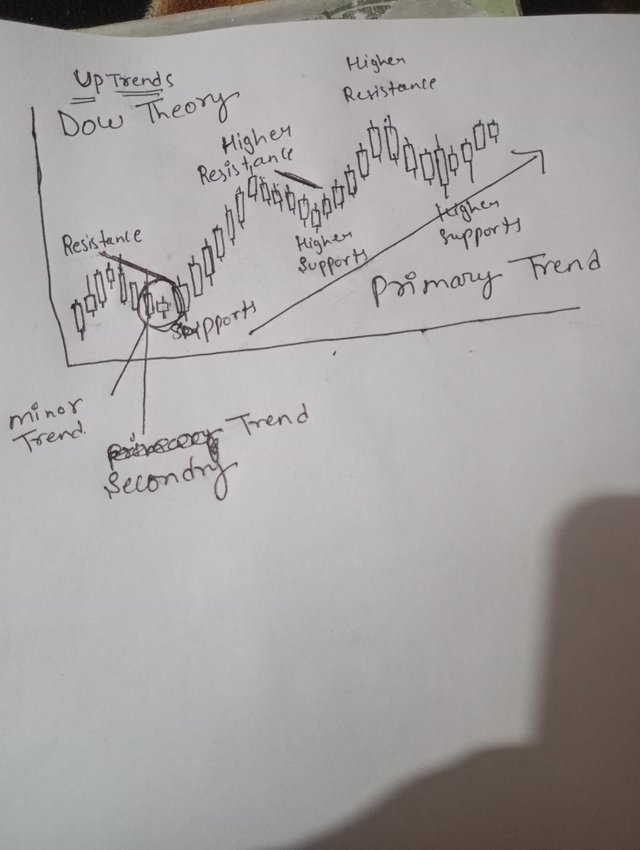 ( image taken with own camera)
You can understand better from the above diagram.
According to Dow Theory Whenever Downtrend or uptrend is going on Then different types of trends are running in these tree trends.
When the uptrend is going on in the market, the higher support and higher resistance are also running at that time.
So goes up and according to the dow theory Then this whole trend is called primary trend.
Primary train means the most elementary move and this is the most important trend.
And those small red candles in the middle of the primary trend, which you see coming down, we also call them secondary trend.And these secondary trends show the correction in the market And in the middle of the secondary trend there are small ups and downs That's called the minor trend.
These are minor trends to the psychology of the traders.
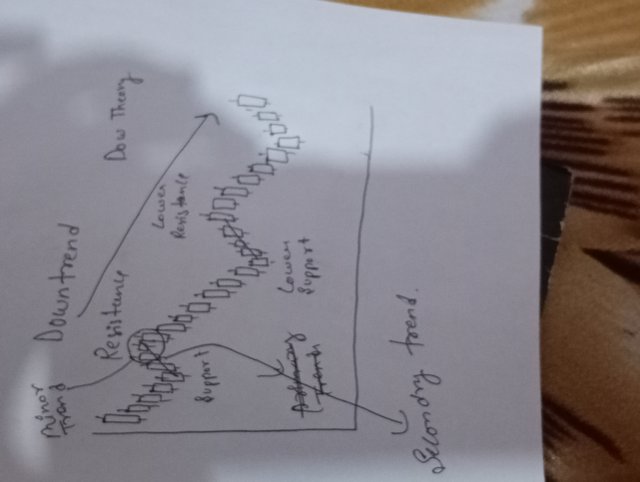 ( image taken with own camera)
You can understand better from the above diagram.
In this time, the low and supporter iron comes down making resistance and a decreasing sequence is visible.This can also be called the primary trend.Which are small candles going up. In the middle of the primary trend, we can also call them secondary trends.And the small ups and downs that come in the secondary trend, we can also call them minor trends .
Benefits of identifying reversal patterns
It becomes very easy before placing a trade because we get to know a lot about it. Because of all these patterns.
Sometimes our guess looks so good that we get a lot of profits.
And we get to know very well how much the price will increase or decrease today or whether the graph will go up or down today. We can measure the things to come a little bit. All these patterns will be there. With help and this pattern is very helpful.
b) How can a fake reversal signal be avoided in the market? (Screenshot needed).
Those fake reversible signals, they cause a lot of harm and to avoid them,and in finance markets especially in the crypto space but there are techniques that can be applied to prevent falling for a fake reversal signal although their crypto is not in the space, and to avoid them, I want to tell you some few patterns.
the most common traders mistakes .
• don't overload your screen with indicator.
• only have display with the indicator that you will actually news on your charts.
• reminder indicator are an indicate of something happen in the market they are note a crystal boll trying to perfact your features .
Example :- I will use make a random indicator and that will get to know from the signal. What we mean to us, we can say that this one KDJ indicator . KDJ is very easy to understand little as stochastic and both are similar little- little .
And they indicated three line, K - line , D- line and J- line . They have also the two unique line with is usually 20 and 80 which indicated when the asset is oversold and overbuy respectively.
Reconfirming trend reversal signals
This is a very good and important method of way to it demands here is patience and discipline on the side of the trader. Sometimes the price goes up. goes up or down. Here you can also say that your trade goes up too much or comes down too much then that You can also call the time as a trend reversal signal.
at the first point we had to wait until we had another lower high at the second point to confirm that this is not a false signal before continuing with our trade further Using the Btcusdt chart above with a 4hr time frames we can observed the Trend reversals from an uptrend to a Downtrend.
Question 2. Give a detailed explanation on the following Trend reversal identification and back up your explanation using the original chart. Do this for both bullish and bearish trends (Screenshots required).
(a) Break of market structure .
I have found that keeping trading simple is the simplest way to say on top to be systematic , and in control of each action that is taken so the
Purely based on a price action trading following the Trend and understanding the market behaviour.it shows higher lows and higher highs but when the price doesn't longer make another higher lows and higher highs, This break in the trend lines will be in an opposite direction to the normal flow of the trend making a break through the trend lines.
Bullish
Bearish
So the EURUSD pair indicates a break in the market structure when the movement of price had to break the previous high by confirming that it moved from bearish to bullish Trend Reversal in the market
b. Break of Trendline
a trend line is a line we draw on our charts that connect the swing highs and swing low during a trending market . This then shows that the bullish Trend had ended as the price will move down and break through the support level hence confirming a bullish to bearish trend reversal had occurred in the market .
But when the movement of this price increases and then reverses and then start moving downward, this shows that the break of trend line is Bullish simply because buyers were unable to push the prices up.
Bullish
as time passes by, the price movement of EURUSD had to reverse by showing an increase in the price of EURUSD hence confirming a bullish divergence from bearish to bullish trend reversal further that chart above, EURUSD pair indicates a Bearish trend as the movement of the price made a lower low at the same time ax the RSI indicator made a higher low .
Bearish
when the movement of this price decrease and reverses and then start moving upward, this shows that the break of trend line is Bearish simply because sellers were unable to push the prices down And there will be a bearish trendline break which is a strong trend reversal signal.
c) Divergence
This concept can be confusing to those who do not understand it.Traders who understand this method close up their market positions before the reversal takes effect . we can say that in an uptrend the chart patterns tells us that it has higher highs but in the RSI tells us the opposite that the lows are lower then this creates a divergence therefore the trend is about to change. price movement in a chart are combined to identify a trend reversal.
Bullish
Bearish
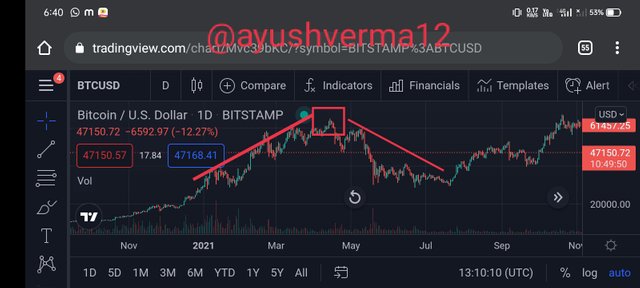
(d) Double top and Double bottom
when the market price trend tends to Create new lower high and the indicator used for the same chart indicate a higher low the results are not in agreement and this is known as divergence.Double tops and bottoms also show that the decreasing dominance power of the buyer or seller at that particular time period.
Bullish
Bearish
3. place a demo trade using any crypto trading platform and enter a buy or sell position using any of the above mentioned trend reversal/continuation pattern.
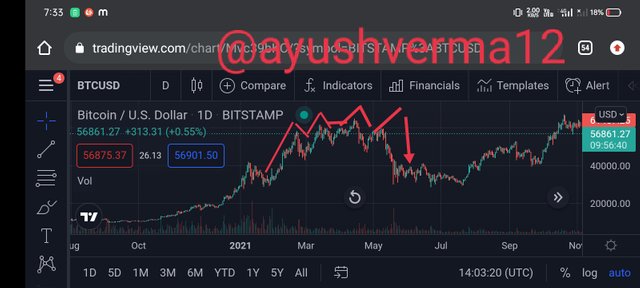
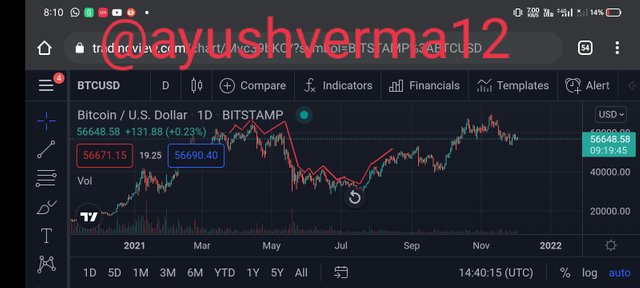
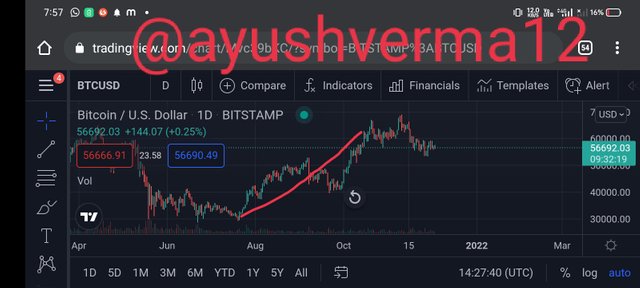
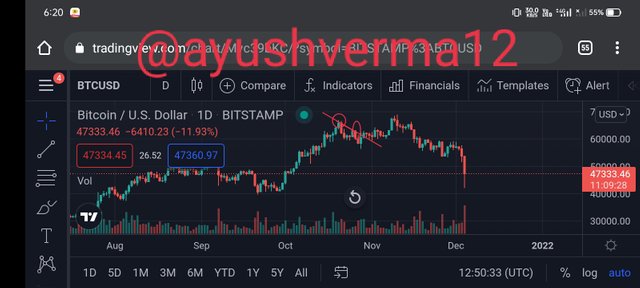
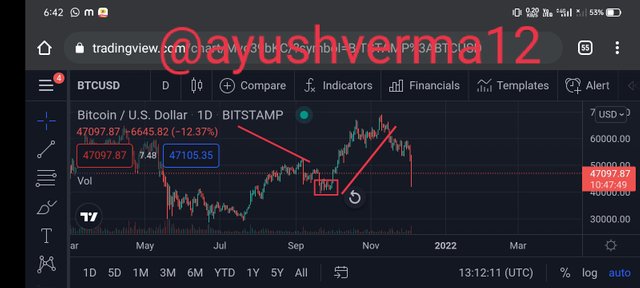
Within my analysis I observed a very interesting trend reversal signal that is the double bottom, when visualizing it I start with my risk management.Having been thoroughly taught all the various trend reversal patterns, it now becomes compulsory to Futher show prove of my of understanding
The trend changed due to the fact that the support was weak and the price was stronger. We can now see that the price now keeps making lower lows and lower highs .
CONCLUSION
there is a higher probability of succeeding if one understands the various trends, trend reversal patterns and market structures and also know how to utilize multiple good technical analysis tools. The traders should enter into the market when the bearish trend reverse into the bullish trend.

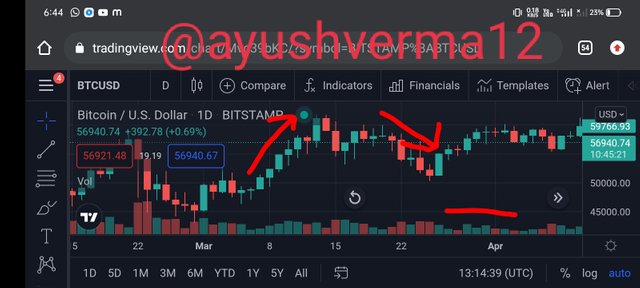
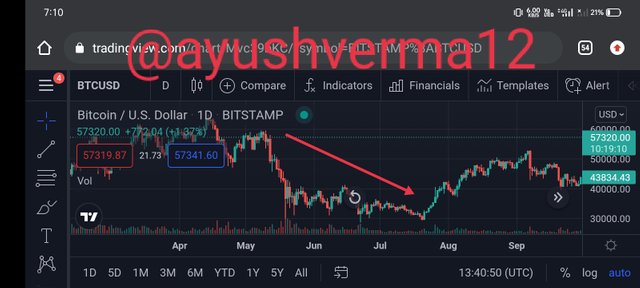
Hello @ayushverma12, I’m glad you participated in the 3rd week Season 5 of the Beginner’s class at the Steemit Crypto Academy.
Unfortunately, it is observed that you haven't powered up to 150 Steem in the last one month. This is a requirement to for #club5050 to participate in the homework task.
Remark: Homework Task Disqualified