Chart analysis of JUP/USDT.

Hello friends , hope you are doing well. Today I will share my JUP/USDT technical analysis. Hope you will find something informative here.
31st January when JUPITER launched in the Binance for trading. Its launching price was 0.69 cents and its all-time high was 0.87 cents. Now its current price is around 0.53 cents.
From 31st to 16th Feb It's continuously making a new lower low. So we can clearly say it's on a downtrend.
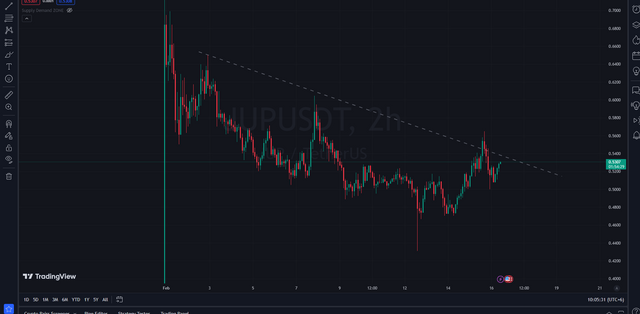
Screenshot from trading view 2h time frame
As we saw It's going down, Should we take it for short? I don't think so. The market can reverse from anywhere as we said It's a new coin. There's no major support or resistance for this coin. It could make a support anywhere.
Also, there is another reason not to take it for short right now. On the 1-hour time frame, we can draw a good support level around 0.515 zone.
We can see the market was trying to break the level over and over and dropped around 0.51 to 0.43. Then the market immediately pools back to the 0.51 zone and did some consolidation then broke the 0.51 zone.
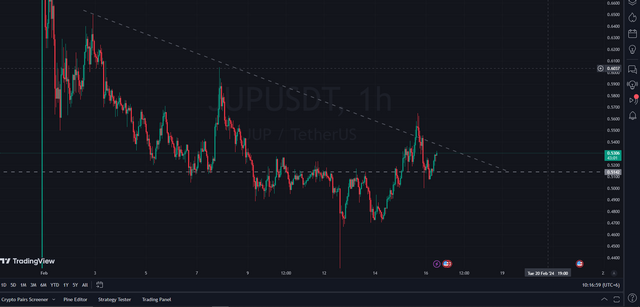
Screenshot from trading view 1h time frame
But still it's trading below the trendline. Now let's analyze it by some indicators. I'm using the 100 Moving average to know the market's structure.
We see the market is making support exactly on the 100MA. It was acting like a resistance in the past now it has turned into a support.
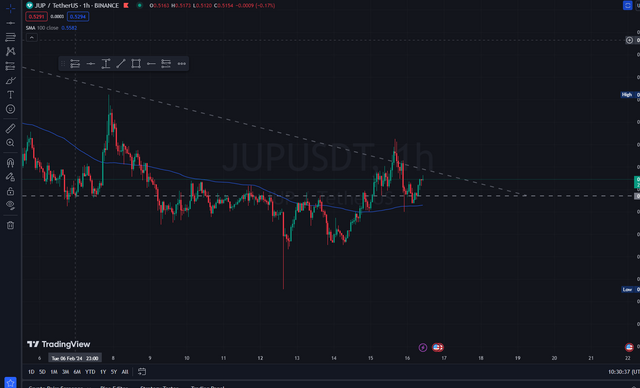
Screenshot from trading view 1h time frame
Those are all the reasons I was feeling uncomfortable with this trade to the downside.
MY PREDICTION
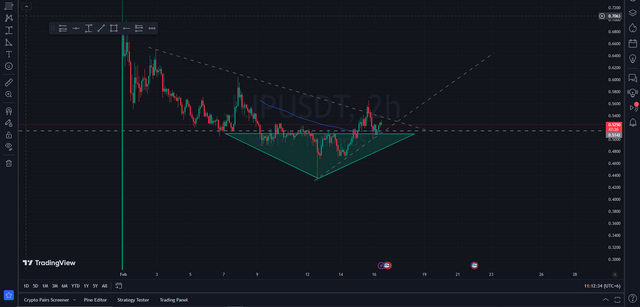
I do think we should only not focus on taking a short position. Because even it's on a downtrend but its making a reversal pattern. I will take a trade to the upside if the downtrend line is broken.
The reason behind this is, that the market is making head and shoulder pattern. As I said JUP doesn't have any big/major support so I will just wait for a reversal pattern. And I think it's making.
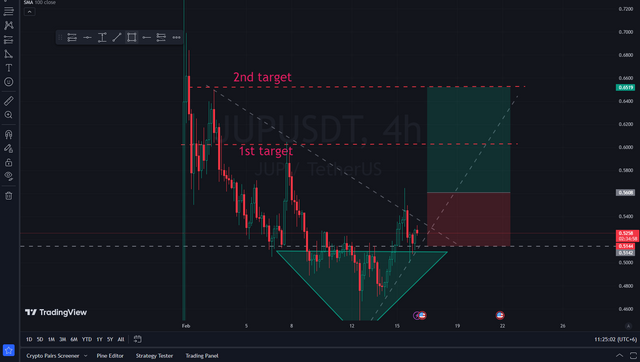
Screenshot from Trading view 4h time frame
If the market breaks the trendline I will take it for long. My 1st target will be 0.60 cents and 2nd target will be 0.65 cents. My experience and my prediction says me to take it long after the trendline breakout. And I hope It will be broken by rejecting at 0.51$.
That's the first time I did a post for market prediction. I'm not a professional trader or a financial advisor but I do trade with price action and analyze the whole market. So if I share my last trade with you, It was a STEEM/USDT trade.
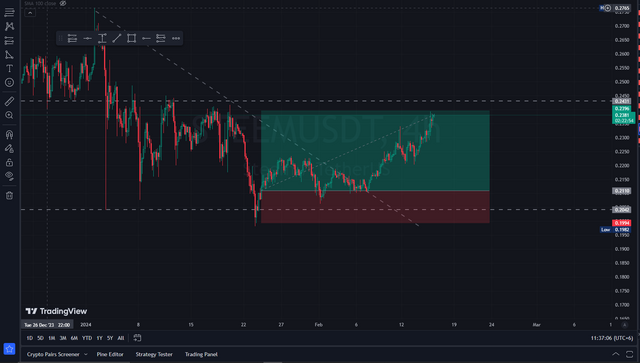
Screenshot from Trading view 4h time frame
I took this trade because Steem has major support at 0.20$. And from early January, we saw the market reached that level around 3 or 4 times. Even when the market reaches that level the volume goes higher. With combining 3-4 confirmations I did this trade and the result was so good.
At last, I'm not a professional trader and I don't even recommend you to take this trade just based on my prediction. I just share my opinion and how I trade. Do your own analysis. That was today. Thanks for your time.

VOTE @bangla.witness as witness

OR

Support @heroism Initiative by Delegating your Steem Power
| 250 SP | 500 SP | 1000 SP | 2000 SP | 5000 SP |
_

https://x.com/ayrin344/status/1758468284855333271?s=20
Note:- Please also make use of the tag #steem and $STEEM in your twitter promotion
Regards,
@jueco