Trading Crypto with Keltner Channels - Crypto Academy / S5W6 - Homework Post for @fredquantum

Introduction
Technical indicators make the work of traders possible and relatively easier. The crypto markets are very volatile and quite a lot of speculation goes into the business. Luckily, technical indicator have made the markets more bearable in spite of the immense volatility.
Speaking of volatility, a couple of technical indicators help to track he volatility of a market for traders. Professor @fredquantum has done quite a good job on explaining one of them which is the Keltner Channels. After going through the lesson, I will now attempt the tasks given.
1. Creatively discuss Keltner Channels in your own words.
The crypto market and other risky markets are characterized by high levels of volatility. Traders are always advised to be cautious because, although huge gains can be made easily, huge losses can also be accrued in a short time. Due to this fact, certain indicators were created to track the volatility and risk level in the market. The Keltner Channels is one of these indicators.
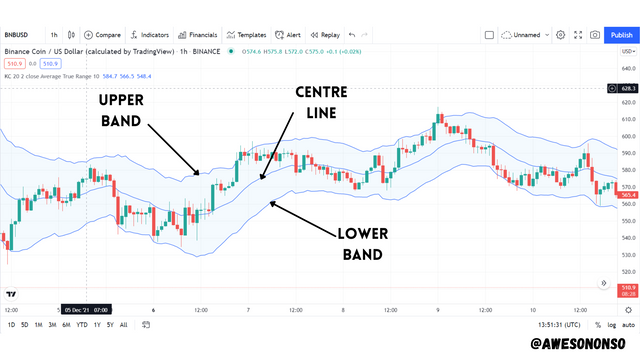
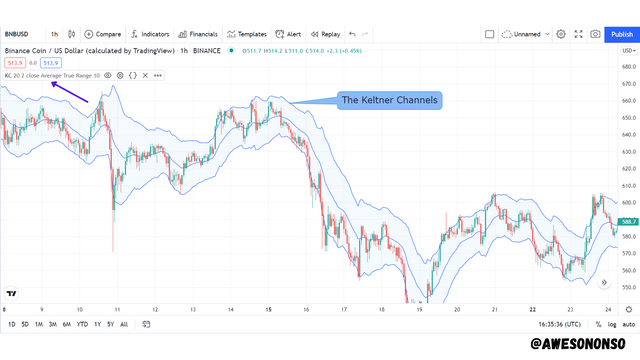
Named after Chester W. Keltner, the Keltner Channels is an indicator that is made up of a three lines - a center line and two channel lines or bands above and below it. Originally, the Keltner channels used a Simple Moving Average of the price as the center line but the modern version, which was developed by Linda Raschke, uses an Exponential Moving Average (EMA) as the center line. By default, the bands are spaced from the center line at a distance of 2x the Average True Range. The bands form above the price functioning together with the center line as dynamic support and resistance levels as most of the price action happens in-between these bands.
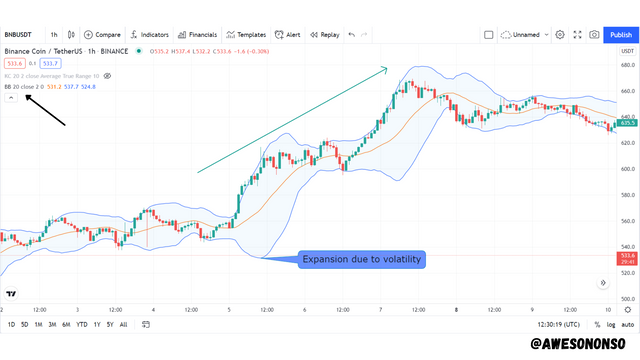
The Keltner Channels functions looks like the Bollinger bands and functions in a similar fashion as well. Just like the Bollinger bands, the expansion and contraction of the bands of the Keltner Channels are influenced by the volatility of the market. A less volatile market would be characterized by tight bands and a horizontal movement of the indicator. A more volatile market would be characterized by wider bands and an upward or downward movement of the indicator depending on the trend direction (bullish or bearish).
Based on what I have said above, it is clear that the Keltner Channels can be used to determine the trend direction of a market and indicate possible breakout points due to the expansion and contraction of the bands and the direction of the indicator as a whole. We will discuss more on this as we advance.
2. Setup Keltner Channels on a Crypto chart using any preferred charting platform. Explain its settings. (Screenshots required).
Setting up the Keltner Channels on TradingView
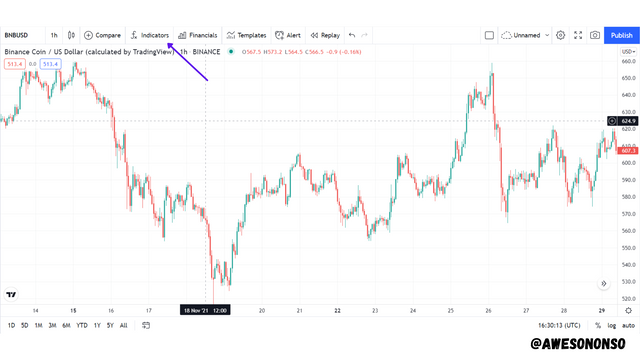
Step 1: Using TradingView, load a desired chart and click on fx indicators.
Step 2: Search for Keltner and choose the indicator.
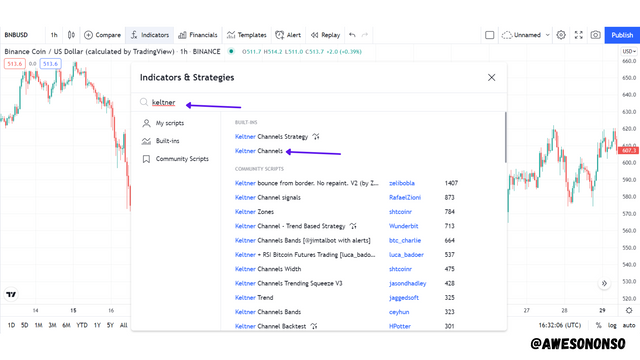
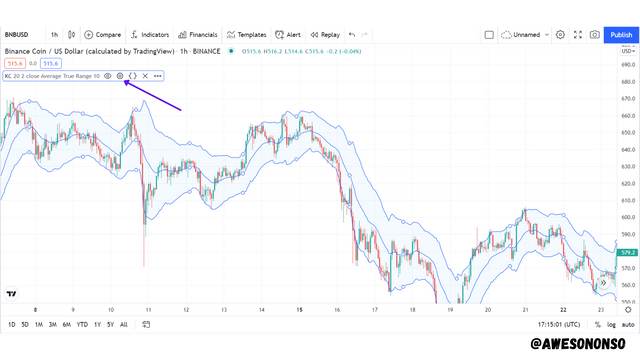
And that's it! The indicator comes up.
Explaining the settings of the indicator
To view the settings, click on the corresponding settings icon.
Inputs
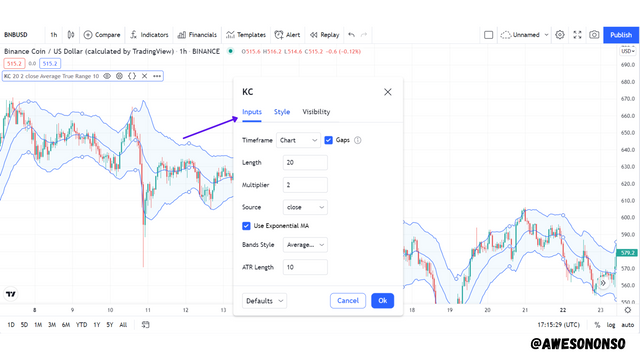
Timeframe: This controls what timeframe the indicator is viewed on. Leaving this setting on Chart means that it gets viewed under the same timeframe as the chart.
Length: This is the number of periods that is considered by the indicator. By default this is set to 20.
Multiplier: This is how much is multiplied by the Band Style to make the distances between the center line and the bands.
Source: This is the price or source data that is considered by the indicator. By default, this is set to close meaning the indicator works with the closing price of each period.
Using Exponential MA: Keeping this voice checked makes the center line and EMA. Unchecking the box, however, makes the center line a Simple Moving Average.
Bands Style: This is what the bands would be based on. By default, this is set to Average True Range.
ATR Length: This is the number of periods of the Average True Length used to calculate the bands. By default this is set to 10. This setting only works when the Bands Style is set to Average True Length.
Style
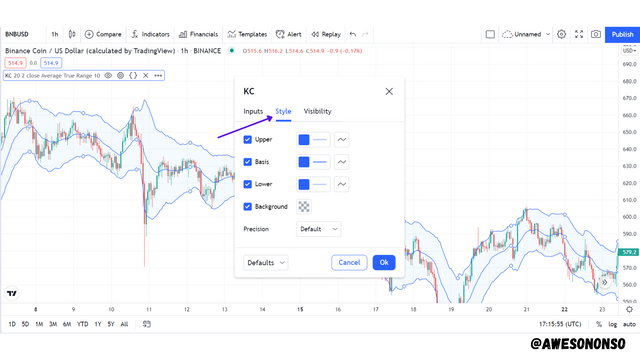
The Style Tab is used to set the indicator to personal taste or preference.
Upper controls the font color and style of the upper band. Unchecking the box beside it would remove the upper band.
Basis controls the font color and style of the center line. Unchecking the box beside it would remove the center line.
Lower controls the font color and style of the lower band. Unchecking the box beside it would remove the lower band.
Background controls the color of the background. Unchecking the box would remove the background.
Precision controls the number of decimal places the indicator readings are rounded up to.
3. How are Keltner Channels calculated? Give an illustrative example.
As mentioned earlier, the Keltner channels is made up of a center line and two bands above and below it. The center line is simply an Exponential moving average of the price action by default.
The bands are calculated by taking the Average True Range(ATR) of the price over a given period (10 by default), applying a multiplier (2 by default) and the adding it to the center line for the upper band or subtracting it from the center line for the lower line. This is actually straightforward and can be visualized on the charts. I will explain further below.
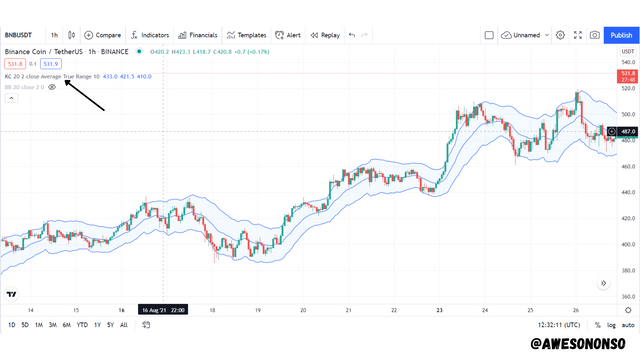
Just like other averages, the ATR is represented as an indicator on the charts. We can easily add the indicator to the chart and see how its values affect the bands on the Keltner Channels.
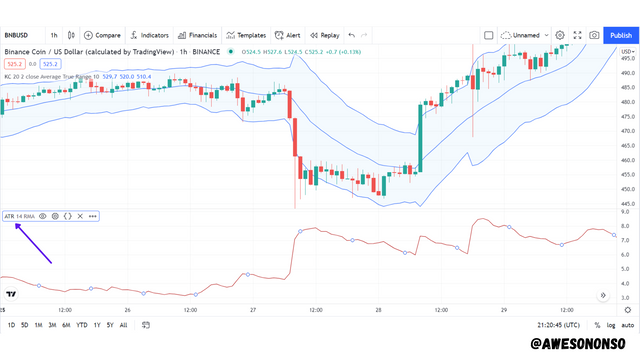
The image above shows a chart with the Keltner Channels and ATR. This is an attempt to demonstrate how the Bands of the Keltner Channels are calculated from the ATR. To do this, we have to change the length of the ATR from a default of 14 periods to 10 periods so that it would match the settings of the Keltner Channels. I did this below.
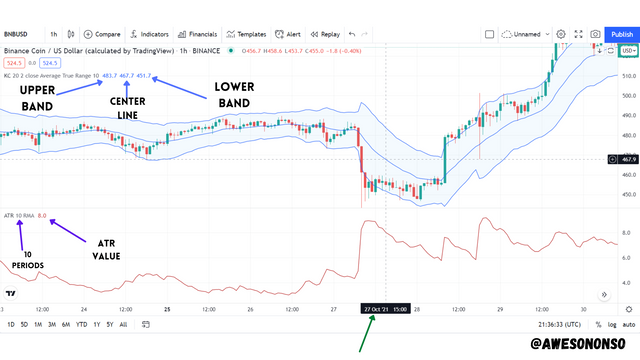
Now, from the image above, I have marked the time 15:00 on the 27th of October 2021. The values for the indicators at that time have also been indicated. The ATR has a value of 8 on a period of 10. For the Keltner Channels, the first number is the value of the upper band, the second is the value of the center line and the last is the value of the lower band. The center line is already calculating by taking the EMA of the price. Now, we will calculate the upper and lower bands with the formulas to check if the values tally.
Center line = 467.7
Upper Band = EMA + (2 x ATR)
= 467.7 + (2 x 8)
= 467.7 + 16
= 483.7 (the same as the value on the chart)
Lower Band = EMA - (2 x ATR)
= 467.7 - (2 x 8)
= 467.7 - 16
= 451.7 (the same as the value on the chart)
So in essence;
Centre Line = 20 period EMA by default
Upper Line = EMA + (2 x ATR)
Lower Line = EMA - (2 x ATR)
4. What's your understanding of Trend confirmation with Keltner Channels in either trend? What does sideways market movement looks like on the Keltner Channels? What should one look out for when combining 200MA with Keltner Channel? Combine a 200MA or any other indicator of choice to validate the trend. (Separate screenshots required)
Trend Confirmation with Keltner Channels
The Keltner Channels can be easily used to identify and properly confirm the direction of a trend. This is done easily by observing the angle of the indicator. Below I talk about the two different scenarios;
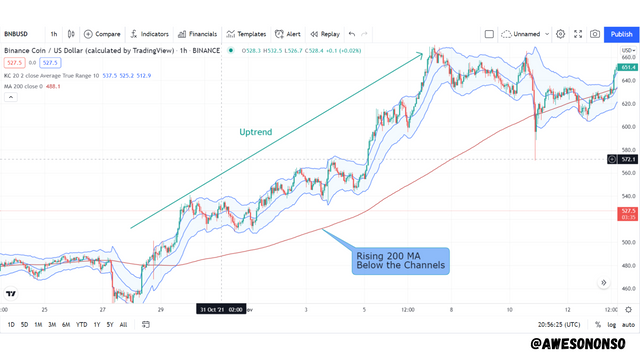
Uptrend
For an uptrend, the Keltner channels would make and move in an upward angle. The price of the asset would move upward with most of the price action between the upper band and center line. In this case, the upper band would act as a resistance to the price while the center line would act as the support.
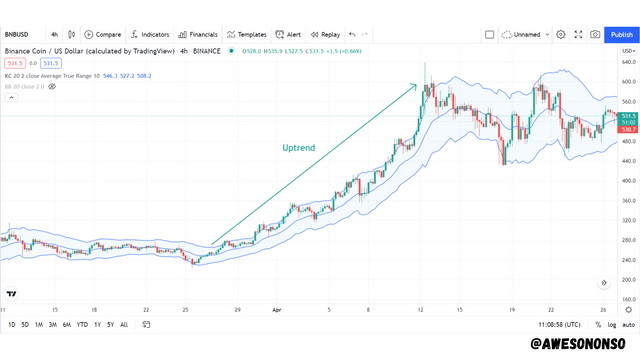
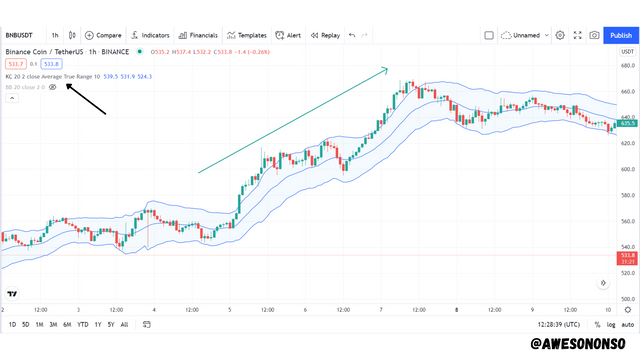
In the image above, we can see an upward movement made by the price of BNB characterized by higher highs and higher lows. The Keltner Channels was able to confirm that it is an uptrend by moving in an upward inclined angle. Also, the price action is between the upper band (resistance) and center line (support).
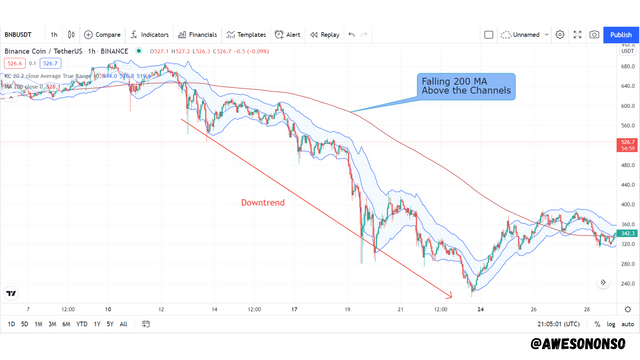
Downtrend
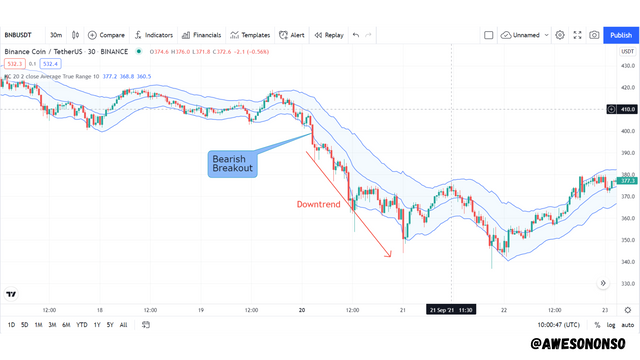
For a downtrend, the Keltner channels would make and move in a downward angle. In this case, the price would move downward with most of the price action between the lower band and the center line. For a downtrend, the lower band would act as a support level while the center line would be the resistance.

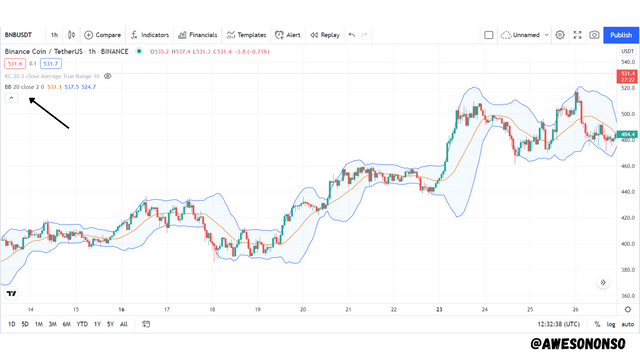
From the image above, there is a clear downward movement made by the price of BNB characterized by the lower lows and lower highs. The Keltner Channels was able to confirm that it is a downtrend by moving in a downward inclined angle. Also, the price action is between the lower band (support) and the center line (resistance).
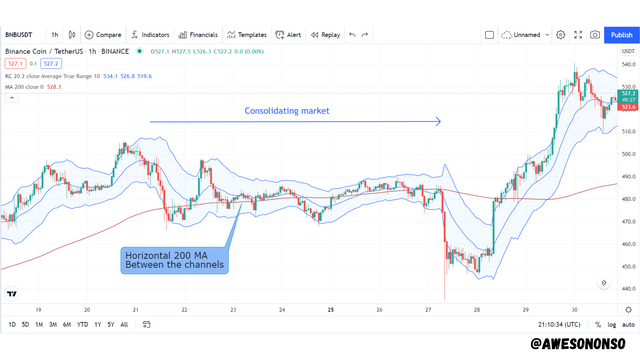
Sideways market of Keltner Channels
A sideways market is basically any market that is not trending. That is, the price of the asset is neither in an uptrend or downtrend but it moves within a less volatile range of prices. This type of market is characterized by low volatility and can be seen clearly on the Keltner Channels.
The bands of the Keltner Channels expand and contract due to volatility. When the market is not trending, the bands contract and move horizontally. The price of the asset in this case would occasionally touch and bounce off the upper and lower bands of the indicator. The upper band would act as resistance to the price and if the price breaks above it, an uptrend would occur. Similarly, the lower band would act as support to the price and if the price breaks below it, a downtrend would occur.
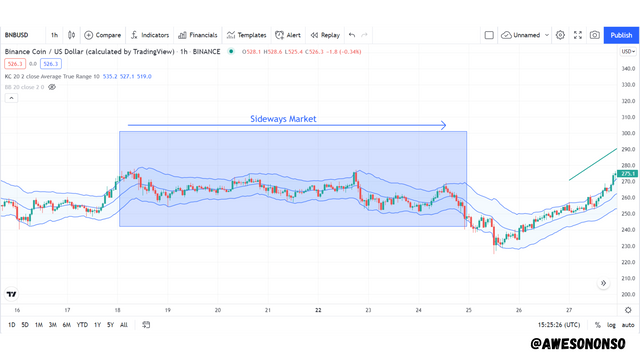
In the image above, we can see how the indicator moves horizontally with the price action. The price occasionally touches the bands and bounces off them maintaining a given price range.
What to look out for when combining 200 MA with Keltner Channels
A 200 period Moving Average can be used to confirm a trend identified by the Keltner Channels. This is achieved by the position of the 200 MA relative to the Keltner Channels.
Bullish Trend
For a bullish Trend, the 200 MA would move upward below the Keltner channels. We can clearly see this in the image below.
Bearish Trend
For a bearish Trend, the 200 MA would move downward above the Keltner channels. We can clearly see this movement in the image below.
Consolidating or Sideways market
For a consolidating market, the 200 MA would move horizontally within the Keltner channels. I have highlighted this in the image below.
Combining the Keltner Channels with a 200 MA or another indicator
For this part I will combine the Keltner Channels with a 200 MA but I will use an asset pair different from the one in the previous question.
Bullish Trend with Keltner Channels and 200 MA
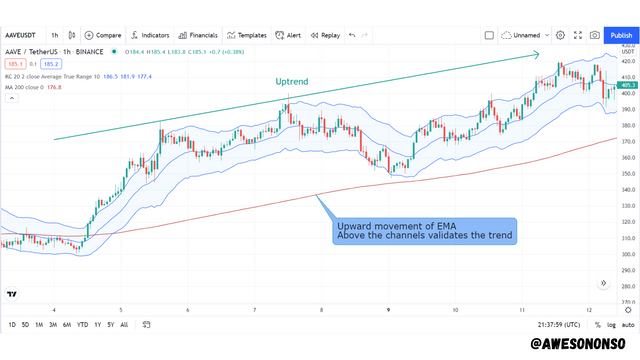
In the AAVE/USDT chart above, the price had started an uptrend by making visible higher highs and higher lows. The Keltner Channels is able to follow the trend by moving in an upward angle. Most of the price action takes place between the upper band (resistance) and center line (support). The 200 MA was able to validate this trend by moving in an upward direction below the Channels. This is clearly seen above.
Bearish Trend with Keltner Channels and 200 MA
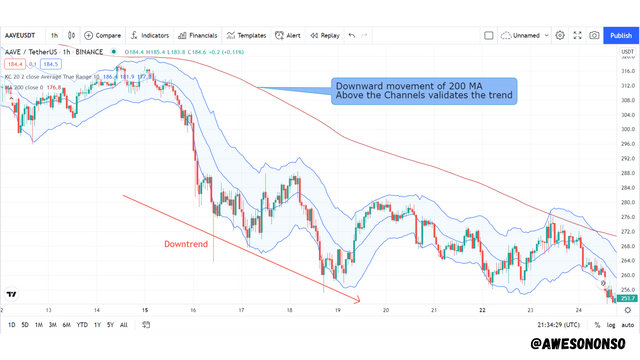
From the image above, the price of AAVE had started a downtrend by making visible lower lows and lower highs. The Keltner Channels is able to follow the trend by moving in a downward angle. Most of the price action takes place between the lower band (support) and center line (resistance). The 200 MA was able to validate this trend by moving in a downward direction above the Channels. This is clearly seen above.
5. What is Dynamic support and resistance? Show clear dynamic support and resistance with Keltner Channels on separate charts. (Screenshots required).
Support and Resistance levels are levels at which an asset's price stops and reverses. These levels are visible as straight horizontal lines on the charts. Resistance levels are levels where the price would hit during an uptrend and then reverse downward. Support levels, are levels where the the price would hit during a downtrend and then reverse upward.
Unlike the regular support and resistance levels, dynamic support and resistance levels are not static on the charts. As the name implies, dynamic resistance and support levels constantly change or evolve alongside the price of the asset. Some indicators like the Moving Average can be set to act as dynamic support and resistance levels.
The Keltner Channels can also function as dynamic support and resistance levels. In a sideways market, the upper band would act as a dynamic resistance level while lower band would act as a dynamic support level. Let's check out the two different scenarios below;
Dynamic Resistance level
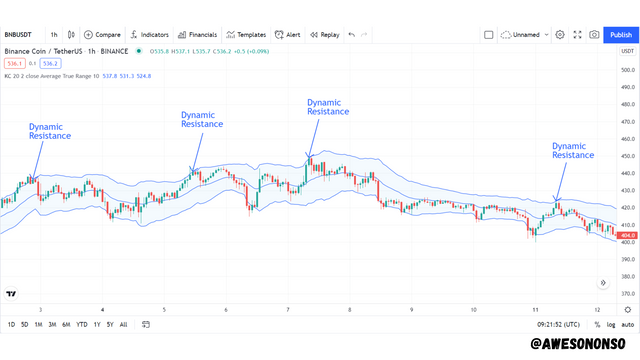
In the chart above, we can see that the upper band acts as a resistance because price would occasionally touch it and reverse downward. This upper band does not stay static rather it evolves as it tracks the price action. This makes it a dynamic resistance.
Dynamic Support level
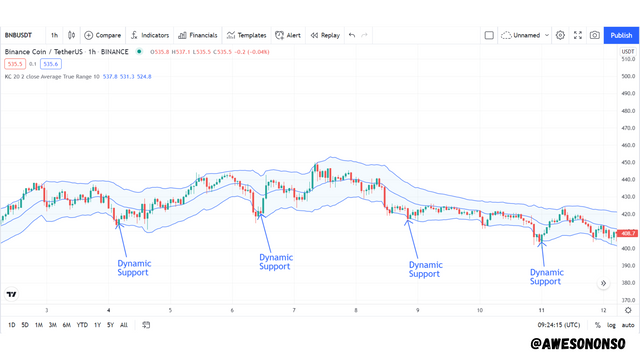
Similarly in the chart above, we can see that the lower band acts as support because price would occasionally touch it and reverse upward. Just like the upper band, this one does not stay static rather it evolves as it tracks the price action. This makes it a dynamic support.
6. What's your understanding of price breakouts in the Crypto ecosystem? Discuss breakouts with Keltner Channels towards different directions. (Screenshots required).
We have properly explained what support and resistance levels are on the charts and how they work. It is important to note that sometimes the price of the asset does not bounce off a support or resistance level rather it breaks it and keeps going. When this happens, a breakout has occurred.
To write it out clearly, a breakout occurs when the price of an asset breaks and closes above/below a resistance/support level to start a trend. We have already established the fact that the bands of the Keltner Channels act as dynamic support and resistance levels. With this, it is safe to say that if the price of the asset breaks the bands, a breakout would likely occur.
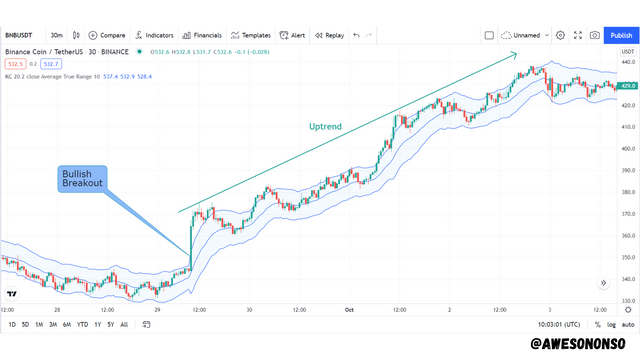
Bullish Breakout
For a bullish breakout to occur, the price would have would have to break and close above the upper band which is the resistance. This would indicate that there would be a possible uptrend. I have demonstrated this in the image below;
Bearish Breakout
For a bearish breakout to occur, the price would have would have to break and close below the lower band which is the support. This would indicate that there would be a possible downtrend. I have demonstrated this in the image below;
7. What are the rules for trading breakouts with Keltner Channels? And show valid charts that work in line with the rules. (Screenshot required).
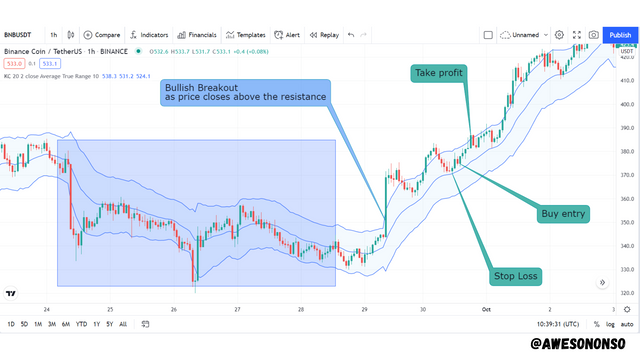
Trading Bullish Breakouts with Keltner Channels
The rules for this include;
- A break would occur above the upper band after a sideways market and the price of the asset would close above the band.
- The price is resisted at that point and begins to move downward.
- The price has to move between the upper and center line to confirm an uptrend. We place a buy entry 2 or 3 candles after the price has been supported by the center line.
- The stop loss would be placed just below the support at the center line.
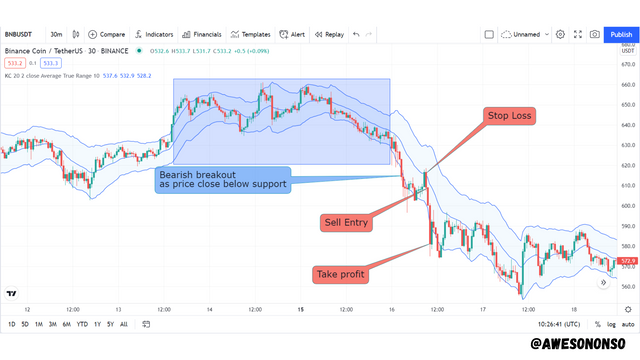
Trading Bearish Breakouts and Keltner Channels
The ruled for this include;
- A break would occur below the lower band after a sideways market and the price of the asset would close below the band.
- The price is resisted at that point and begins to move upward.
- The price has to move between the lower and center line to confirm an uptrend. We place a buy entry 2 or 3 candles after the price has been supported by the center line.
- The stop loss would be placed just below the support at the center line.
8. Compare and Contrast Keltner Channels with Bollinger Bands. State distinctive differences.
The Keltner Channels are physically the same. They both are made of a center line and two bands above and below the center line. However, if we go deep into their structures and functionalities, we would notice that they are not the same.
Differences Between the Bollinger Bands and the Keltner Channels
Center Line
For the Keltner Channels, the center line is simply an Exponential Moving Average (EMA) of the price periods considered. The center line of theBollinger Bands however, is a Simple Moving Average (SMA) of the price periods considered.
Calculation of Bands
The Bands of these two indicators are also calculated differently. For the Keltner Channels, the Average True Range is used to calculate the bands. The formulas are;
Upper Band = EMA + (2 x ATR)
Lower Band = EMA - (2 x ATR)
For the Bollinger Bands, Standard deviations are used to calculate the bands. To determine the Standard Deviation, we use the formula;
Standard Deviation = √Variance
Variance = [Σ(price - Moving Average)] / Number of Periods
The formula for the Bollinger bands are then given as;
Upper Band = SMA + (2 x Standard Deviation)
Lower Band = SMA - (2 x Standard Deviation)
Sensitivity
Another importance difference between the Keltner Channels and the Bollinger Bands is in their sensitivities. The Bollinger Bands are more sensitive to volatility than the Keltner Channels. This is visible by the contraction and expansion of the bands. Very volatile markets would see the bands expand significantly. I'll illustrate this below;
In the chart above, we can see that the Keltner Channels show that the market is in an uptrend just by the angle of the indicator.
The image above is a similar chart to the previous one but with the Bollinger Bands. We can see how the lower band expands downward as the uptrend began. This is a response to a lot of volatility in the market. The fact that the Bollinger bands are more sensitive to volatility makes them more susceptible to false signals.
9. Place at least 4 trades (2 for sell position and 2 for buy position) using breakouts with Keltner Channels with proper trade management. Note: Use a Demo account for the purpose and it must be recent trade. (Screenshots required).
A. Sell Trade 1
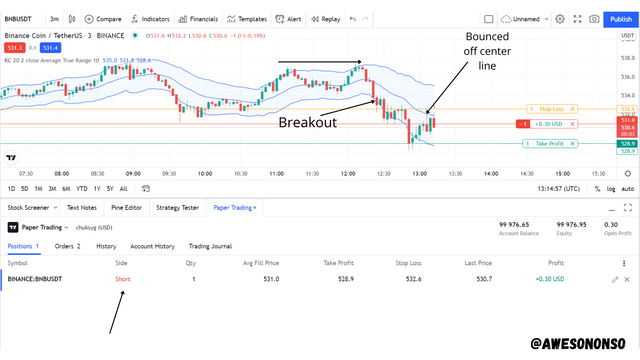
Using a 3 minute Timeframe on the BNB/USDT chart, I noticed that the market had been ranging for while. After a breakout occurred on the lower band, I waited for the price to bounce off the center line. After it had bounced off, I placed a Sell entry after 2 candles.
- Take Profit - 532.6
- Stop Loss - 528.9
B. Buy Trade 1
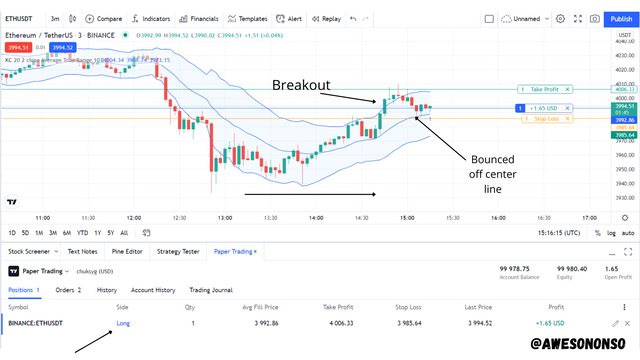
Using a 3 minute Timeframe on the ETH/USDT chart, I noticed that the market had been ranging for while. After a breakout occurred on the upper band, I waited for the price to bounce off the center line. After it had bounced off, I placed a Buy entry after 3 candles.
- Take Profit - 4006.33
- Stop Loss - 3985.64
C. Sell Trade 2
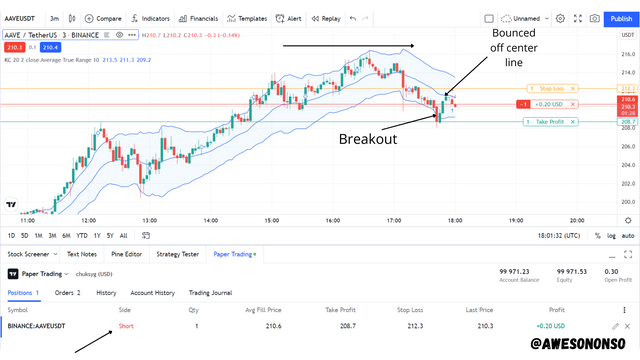
Using a 3 minute Timeframe on the AAVE/USDT chart, I noticed that the market had been ranging for while. After a breakout occurred on the lower band, I waited for the price to bounce off the center line. After it had bounced off, I placed a Sell entry after 2 candles.
- Take Profit - 208.7
- Stop Loss - 212.3
D. Buy Trade 2
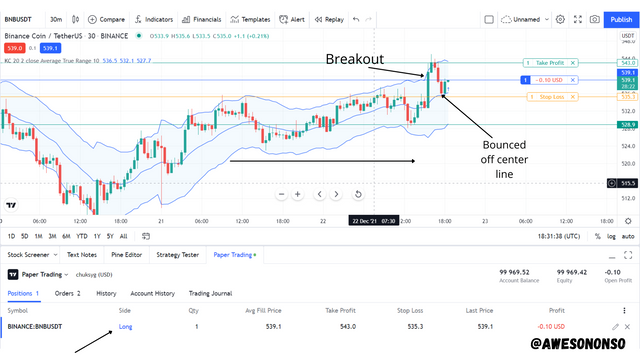
Using a 30 minute Timeframe on the BNB/USDT chart, I noticed that the market had been ranging for while. After a breakout occurred on the upper band, I waited for the price to bounce off the center line. After it had bounced off, I placed a Buy entry after 2 candles.
- Take Profit - 543.0
- Stop Loss - 535.3
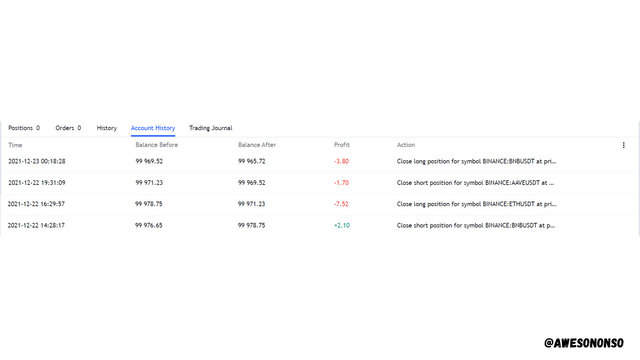
Outcome of All the Trades
10. What are the advantages and disadvantages of Keltner Channels?
Advantages
A.) The Keltner Channels is very useful in identifying price breakouts thanks to its dynamic support and resistance levels.
B.) The indicator is very useful in identifying the direction of a trend simply by its angle of movement.
C.) The indicator is quite easy to understand.
D.) The indicator incorporates the Average True Range in its bands which makes it less sensitive to volatility and so reducing noise in its signals.
Disadvantages
A.) The Keltner Channels is a lagging indicator which might give late signals sometimes.
B.) Since the indicator tracks volatility, it might give off false signals when there are sudden changes in the market.
Conclusion
The Keltner Channels has its strengths and weaknesses just like any other indicator. However, knowing how to use the indicator can be very profitable for traders especially with the fact that the indicator is volatility-based.
In the task, we have seen how the Keltner Channels can be used to identify a trend and trade breakouts. We have also been able to combine it with a 200 MA and compare it to the Bollinger Bands. Also, we have learned the functionalities of the indicator and had some practice with it. In spite of all these, it is still worth mentioning that traders should be cautious when trading with any indicator including the Keltner Channels.
Great write up @awesononso.
Thank you very much