[Crypto Trading With SuperTrend Indicator]- Crypto Academy /S5W7-Homework Post for kouba01

Introduction
Trading is always done in the direction of an trend in order to maximize profits. However, working with just price action alone might not be a very effective way to identify the dominant trend in a market in the midst of all the noise. Because of this, certain indicators have been developed for the purpose of identifying and following the major trend of a market. The SuperTrend is one of these indicators and professor @kouba01 has properly explained the use and structure of this indicator. With the knowledge gained from the lecture, I will complete the tasks given to the best of my abilities.
1. Show your understanding of the SuperTrend as a trading indicator and how it is calculated?
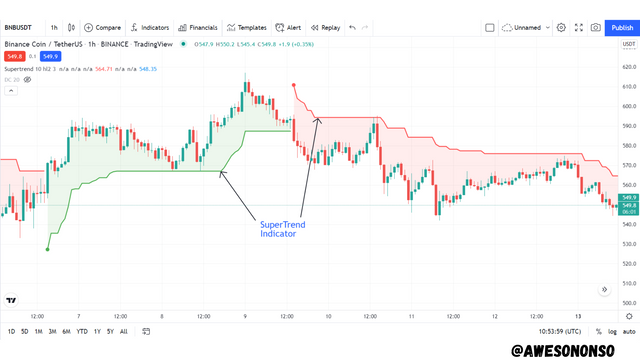
The Supertrend indicator is a popular trend following indicator that is easy to use even for beginners. It tracks the trend of the market by the position it is plotted and its color. In an uptrend, the indicator turns Green by default and is plotted under the price as support as it makes an upward movement. In a downtrend, the indicator turns Red by default and is plotted over the price as resistance as it makes a downward movement. During a sideways market, the indicator simply moves horizontally above or below the price.
The supertrend is similar to a Moving Average in the sense that is follows trends and acts as a dynamic support and resistance level to price. However, unlike a Moving Average, the supertrend does not cross the price action in a trend reversal rather it just starts at a value in the opposite direction and is plotted to follow the new trend. We can say that it flips to the other side during such reversals just like the Parabolic Sar.
How the Supertrend is calculated
The Supertrend is calculated using the Average True Range of a specified period. The ATR helps to adjust the indicator according to the volatility of the market. The formula for this indicator is given as;
To start the calculation, we need to first obtain the ATR of the periods considered. The ATR is calculated by firstly calculating the True Range. This True Range is the largest number of the outcome of 3 formulas which are;
- Current high - Current Low
- Absolute value (Current high - Previous Close)
- Absolute value (Current low - previous Close)
After selecting the highest value among these the formula below is applied;
- ATRn = [ATRn-1 x (n-1) + TRn] / n
After the ATR is obtained, it is applied to the formula of the Supertrend. A multiplier is applied and is added to the average of the high and low prices to give the value for the line above during a downtrend. In an uptrend however, it is subtracted from the average to give the value of the line below.
To know the where and how the supertrend will be plotted on each period, it is important to check parameters like the closing prices and Supertrend values of the current period and previous period. This can be calculated with Excel to make sure that the indicator always follows the trend.
2. What are the main parameters of the Supertrend indicator and How to configure them and is it advisable to change its default settings? (Screenshot required)
The main parameters of the Supertrend indicator are the ATR period and ATR multiplier or factor. To configure this, we will have to click on the Settings button after adding the indicator to the chart.
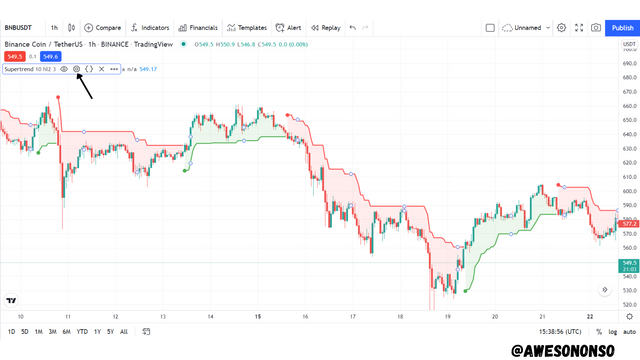
Under the input tab, we can see the parameters in question.
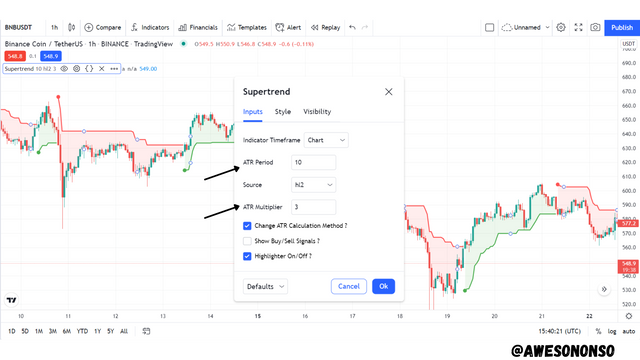
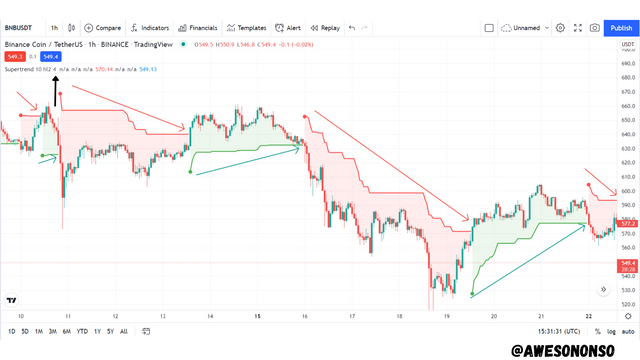
The values, 10 for period and 3 for multiplier, are the default for these parameters. We can see how they form the indicator in the chart below;
The screenshot above would be used as a reference to answer the questions above. Now, I will change the settings for both the period and the multiplier and observe how they affect the indicator.
ATR Period
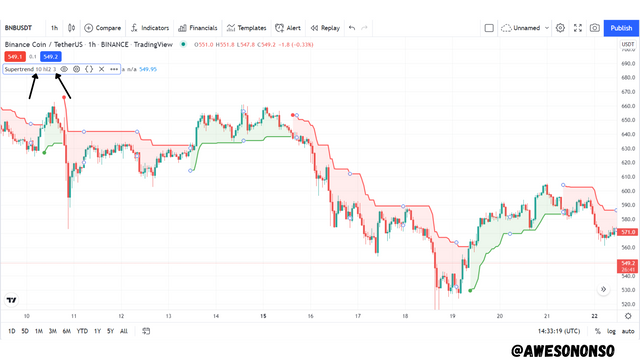
I will change the ATR period to 5 and 10 and see how it changes.
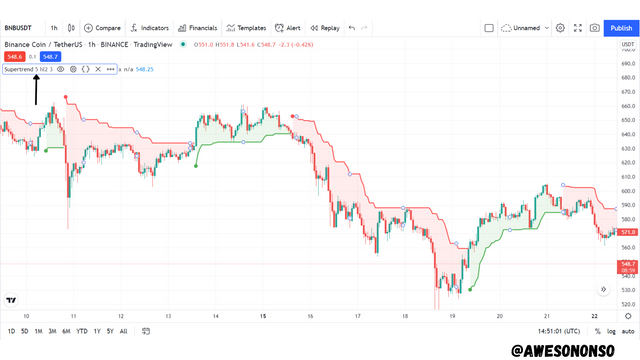
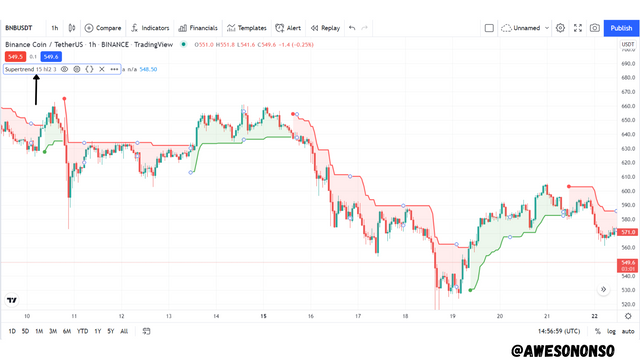
In the first screenshot above, I changed the ATR period to 5 and in the second one I changed it to 15. From my observations, there were more peaks and a few late signals on the indicator with a lesser period of 5. Conversely, the indicator was flatter and had a few early signals with a bigger period of 15. Apart from these, there were not much differences.
ATR MultiplierM
In the image above, the ATR Multiplier is set to 2. This setting makes the indicator more sensitive to the market volatility. This makes it generate more signals even during retracements in the short term. I think this lower setting would be good for scalp traders or other short-term traders who need fast signals. This type of setting, however, is also prone to more false signals.
In the image above, the Multiplier is set to 4. This setting makes it less sensitive to the market volatility and so the indicator generates less signals. Although it generates less signals, it is less prone to false signals as it filters noise during retracements.
In conclusion, the indicator should be set to individual preference and according to one's trading strategy. However, before employing any particular setting, it is important for traders to backtest their strategy and practice with it before entering the market. As for me, I would not choose to change the settings.
3. Based on the use of the SuperTend indicator, how can one predict whether the trend will be bullish or bearish (screenshot required)
Like we said earlier, the SuperTrend indicator is a Trend following indicator. It identifies a trend by its colour and directional movement.
Bullish trend
For a bullish trend, the indicator would be green and would be plotted under the price action. At this point it would serve as a dynamic support level to the price. I illustrated this in the chart below;
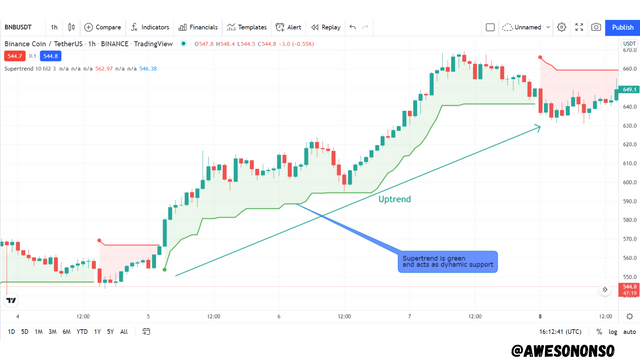
As we can see in the chart below, the Supertrend is green and is under the entire price action. In this case, it acts as a dynamic support level to the price.
Bearish trend
For a bearish trend, the supertrend would be green and would be pllotted above the price action. At this point it would serve as a dynamic resistance level to the price. I illustrated this in the chart below;
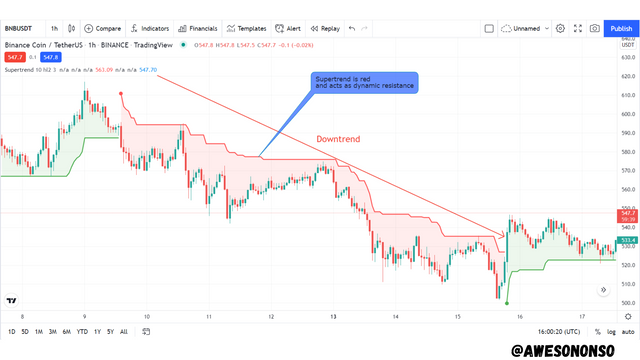
As we can see in the chart below, the Supertrend is red and is above the entire price action. In this case, it acts as a dynamic resistance level to the price.
4. Explain how the Supertrend indicator is also used to understand sell / buy signals, by analyzing its different movements.(screenshot required)
Just as the supertrend can be used to identify the current market trend, it can also be used to open successful trades. The key to this is to enter positions during reversals.
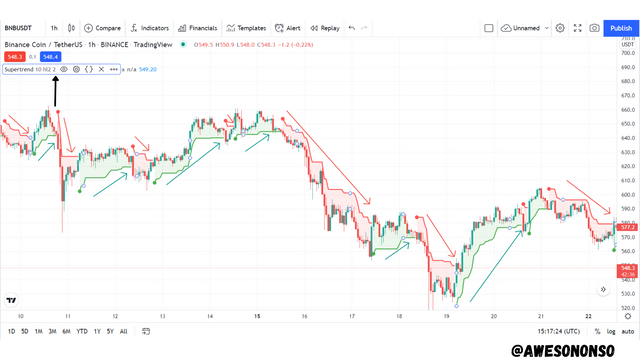
Buy Signal
For a buy signal, the price of the asset would be in an uptrend while the supertrend would be in a downtrend initially. Once the supertrend goes under the price and turns green, then we open a buy position.
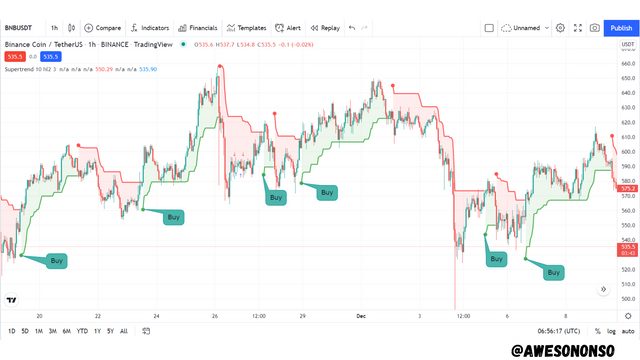
In the image above, we can see a couple of buy entries that were successfully indicated by the supertrend.
Sell Signal
A sell signal works similar to a buy signal but in the opposite direction. In this case, the price of the asset would be in a downtrend while the supertrend would be in an uptrend initially. Once the supertrend goes above the price and turns red, then we open a sell position.
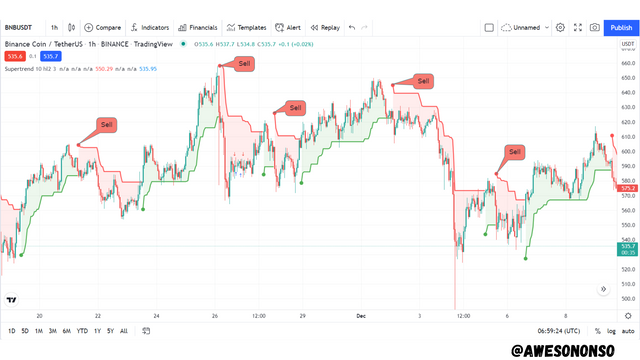
In the image above, we can see a couple of sell entries that were successfully indicated by the supertrend.
Using this strategy, a lot of people would wait for the supertrend to change position and colour before closing a position. For me, I would take profit at a reasonable price level from my analysis.
5. How can we determine breakout points using Supertrend and Donchian Channel indicators? Explain this based on a clear examples. (Screenshot required))
To determine breakout points, the supertrend is used as a filter to confirm the signals indicated by the Donchain channel.
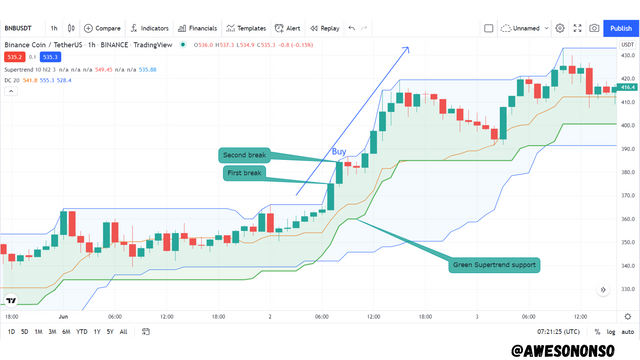
Bullish Breakout
For a bullish breakout, two Consecutive candles would break the upper limit of the Donchain channel. The supertrend would have to be green serving as support to the price. This is a confirmation that there would be a bullish breakout.
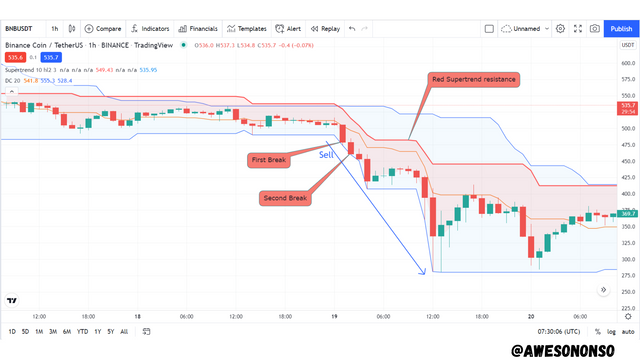
Bearish Breakout
For a bearish breakout, two Consecutive candles would break the lower limit of the Donchain channel. The supertrend in this case would have to be red serving as resistance to the price. This is a confirmation that there would be a bearish breakout.
6. Do you see the effectiveness of combining two SuperTrend indicators (fast and slow) in crypto trading? Explain this based on a clear example. (Screenshot required)
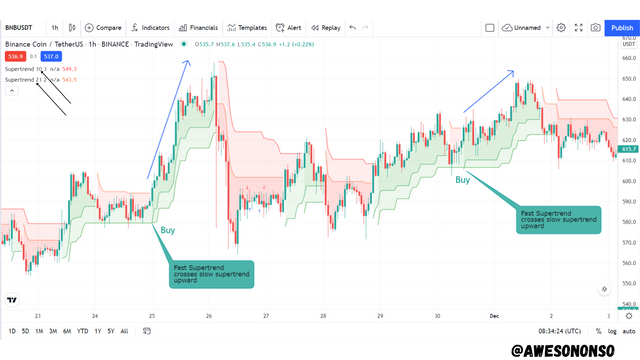
Yes I really think two supertrends would be very effective when trading. To demonstrate this, I will use two different supertrends with parameters 10,3 (slow) and 21,2 (fast) just as directed in the lesson.
These two indicators generate and confirm signals through crosses and their positions. I will illustrate for the two market conditions.
Buy Signal
To obtain a buy signal with this strategy, we would normally wait for the fast supertrend to cross the slow one upward and both would be green. The two indicators would now serve as support to the price during the run. We close the position when the fast supertrend turns red.
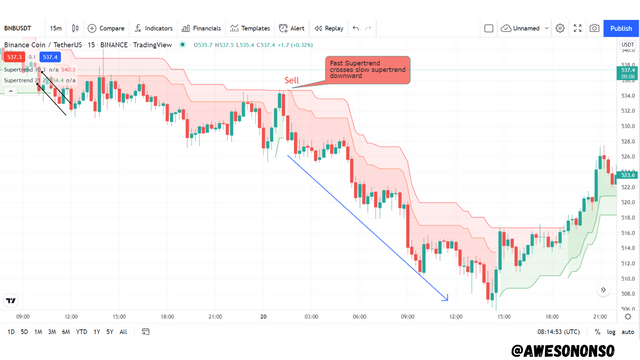
Sell Signal
For a sell signal we follow the reverse of the steps for a buy signal. In this case, we would wait for the fast supertrend to cross the slow one downward and both would be red. The two indicators would now serve as resistance to the price during the run. We close the position when the fast supertrend turns green.
7. Is there a need to pair another indicator to make this indicator work better as a filter and help get rid of false signals? Use a graphic to support your answer. (screenshot required)
Of course it is important to pair indicators when trading. the Supertrend can work as a great filter if it is combined with an indicator like the Parabolic Sar for example.
The SAR is a faster and more sensitive than the Supertrend and so generates more signals. The Supertrend can help filter out false signals and unnecessary noise when used alongside this indicator. When a position is opened as confirmed, it will not be closed until both indicators give the same signals.
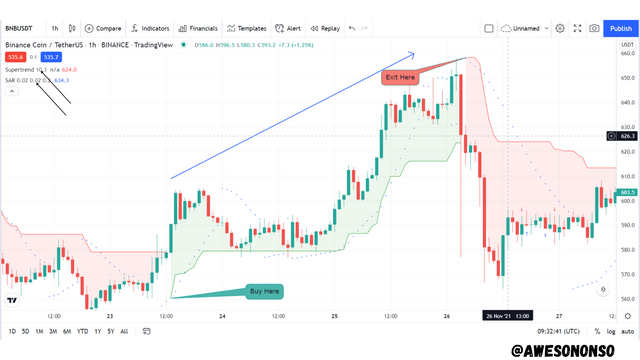
Buy Signal
For a buy signal, the SAR would give a buy signal when it is under the price as support. We open a buy position once the supertrend turns green. We continue riding the trend as long as the supertrend remains green despite any small signals given by the SAR. We close the position when both the SAR and supertrend flip positions.
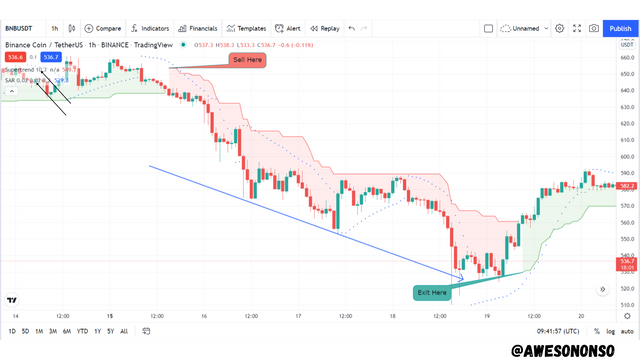
Sell Signal
For a sell signal, the SAR would give a sell signal when it is over the price as a resistance level. We open a sell position once the supertrend turns red and continue to ride the trend as long as the supertrend is red. We do not close the position until both the SAR and Supertrend flip the other direction.
8. List the advantages and disadvantages of the Supertrend indicator:
dynamic support and resistance
Advantages
The Supertrend is great at indicating the direction of a trend.
The indicator is quite easy to understand.
It acts as dynamic support and resistance levels to the price.
The indicator combines well with other indicators to confirm signals.
Disadvantages
Sometimes the supertrend give late signals which minimizes profit opportunities.
It can be prone to noisy signals especially the ATR multiplier is reduced.
The indicator is not suitable for a sideways market. It is only suitable for trending markets.
Conclusion
It is clear that the supertrend indicator is thought to be very reliable by traders everwhere. The indicator works well to follow the trend of a market giving traders the chance to make proper trading decisions.
The Supertrend is very efficient and, as we have learned, very easy to use as well. It is important though, to practice the use of the indicator according to our trading strategies before facing the market. It is also important to note that this indicator should not be used alone due to the fact that it can give off late and false signals.