SEC S18-W5 || Mastering Trading with Stochastics and Parabolic SAR
Hi Steemians! It's another week for us here to engage in crucial discussion about the application of technical indicators such as the Parabolic sar and the stochastic oscillator.
After the closing of the candle at 72,00, the SAR started trending downwards. To confirm this trade signal, the
It is not a subject for debate that the use of technical indicators helps traders provide directions in prices of crypto. There are quite a number of different indicators as a trading tool, but traders could just a few of them that would be suitable for their trading strategy or styles.
In a trader's technical toolbox, the SAR and the STOCHASTICS are useful indicators that traders could be used to identify trends directions and maximize their profit potentials.
That generally being said, let me now go in to address the subject matter of this CHALLENGE that the host of this competition has brought forward.
- The Components Of Stochastic Oscillator And How It Helps To Identify Overbought And Oversold Conditions In The Market:
STOCHASTICS OSCILLATOR DEFINED:
STOCHASTICS is a momentum indicator which could be used to evaluates the specific closing price of crypto pair in comparison to a range of its prices in a given period of time.
The Components of the Stochastics Oscillator includes:
- The trend reverse signal
- Overbought and the Oversold region
- The crossover signal lines
- The %Dline and %kline
- The trend strength with momentum
- The bullish and bearish point of divergence
This Oscillator uses the percentage format that ranges from 0 to 100. If the reading is at 20 the market is in Oversold condition. On the other hand, of the reading is at the 80 level, then the market is in Overbought condition.
- The Parabolic SAR Indicator And Its Application In Identifying The Trend Direction. How it is interpreted differently in an uptrend compared to a downtrend?
THE PARABOLIC SAR DEFINED
The Parabolic SAR is an indicator used when trying to identify potential reversals in the price of a crypto pair.
SAR Application In Identifying Trends
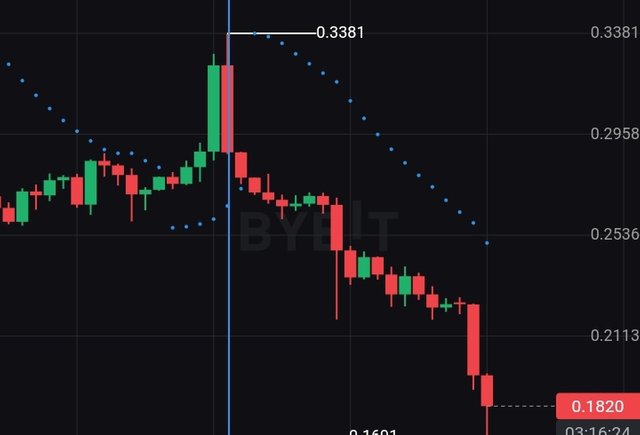
As the picture above shows, the SAR is represented by the dotted lines above and below the price charts.
Now when the SAR dots are above the price charts and moving downwards, the market is regarded to be downtrend and a signal to SELL. If the SAR is below the price charts and then moving upwards, the market is regarded to be uptrend and a signal to BUY. Catching the trend early enough would generate more profits.
- How can the combination of the Stochastic Oscillator and Parabolic SAR be used to create a robust trading strategy? Provide a detailed explanation.
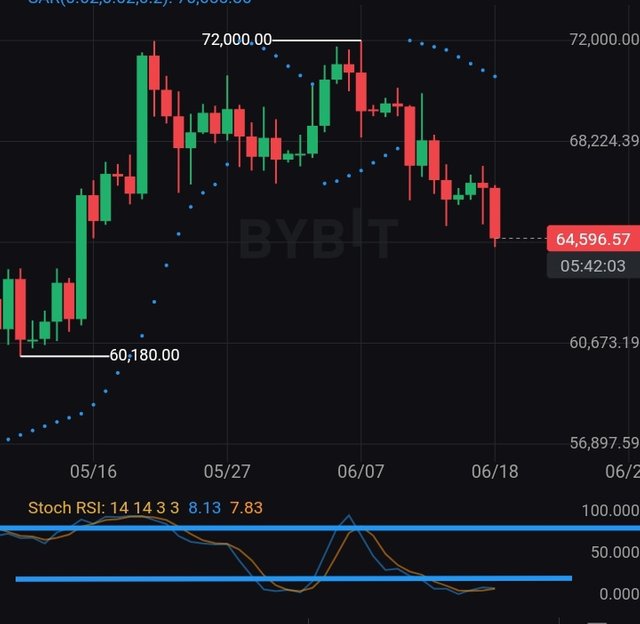
TRADING STRATEGY: SHORT ENTRY FOR DAILY CHART
From the picture above, the **SAR ** is used to indicate the trend while the STOCHASTICS is is used to confirm a trade signal.
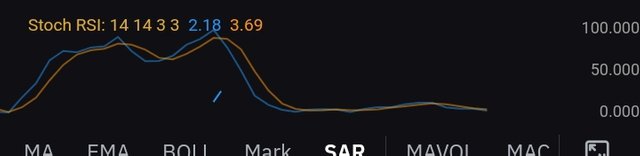
Upper blue line is for the 80 mark oscillatory movement and the lower blue line indicates the 20 mark oscillatory movement.
After the uptrend ended, a bearish candle closed at 72, 000. The bulls tried to push the price for continuation of the upper trend but failed. The bears dominated as the SAR starts trending downwards.
A SELL signal is Confirmed as the downtrend was strengthened by the Oscillator at its Overbought region begins to decline below 80 and then crossed theRSI to gain further confirmation of the downtrend.
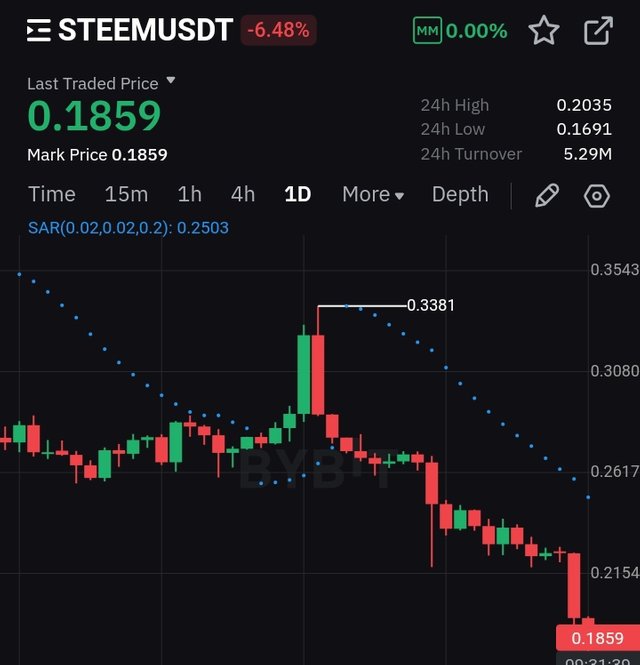
- Using historical data, analyze a trading scenario for the STEEM/USDT pair where the Stochastic Oscillator indicated an oversold condition. How would you use this information along with the Parabolic SAR to make a trading decision?
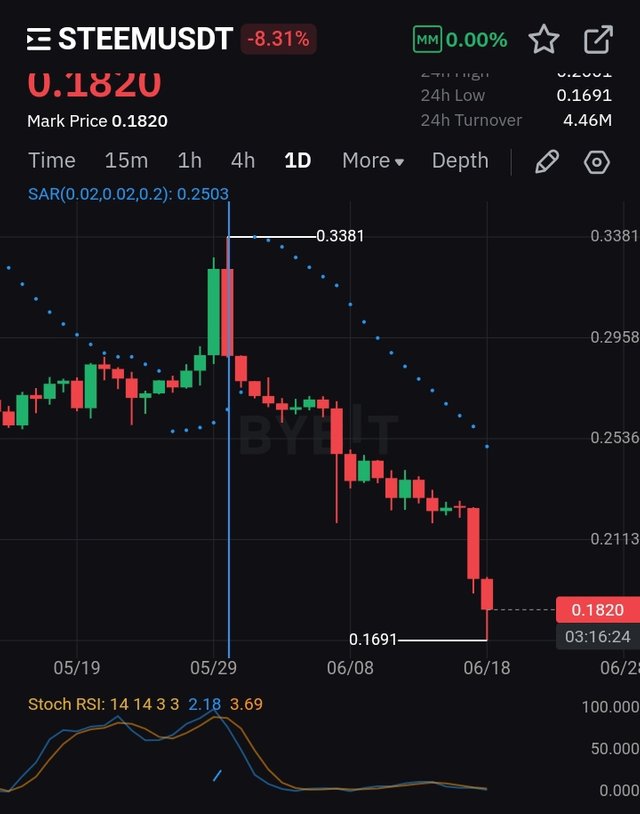
From the picture above, steem is already at its Oversold region as indicated by the Oscillator moving even below the 20 mark line and then crossing the RSI which shows weakness in the direction.
Steem has maintained a steady decline and price becoming flat. The downtrend is either pausing for a possible reversal or the downtrend continues.
The decision to make here is to wait for a bullish candle to close above the current bearish candle. If this should happen, then a reversal is possible and the SAR will move below the a price chart. But this is not yet enough to enter a BUy trade. A confirmation to make a BUY decision is to wait for the Oscillator to move above 20 heading to hit 50 which is the midpoint between the Overbought and Oversold market.
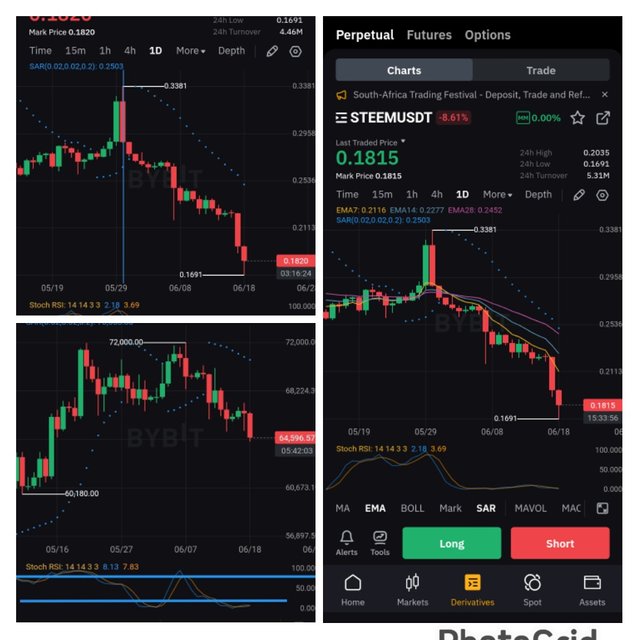
All pictures for analysis are screenshots from the Bybit platform