Ultimate oscillator indicator- Steemit Crypto Academy- S5W8-Homework post for @utsavsaxena11

Welcome once again to another wonderful episode in the crypto Academy community. Before I present my homework post, I would like to acknowledge the professors and the crypto Academy community for making such an educative lecture possible. Today’s topic is simple Trading with Ultimate oscillator
Without wasting enough time I would present my homework post systematically based on the questions from the professor @utsavsaxena11.

What do you understand by ultimate oscillator indicator. How to calculate ultimate oscillator value for a particular candle or time frame. Give real example using chart pattern, show complete calculation with accurate result.
The ultimate indicator
Trading is now the order of the day. Many people associated with the crypto ecosystem use different strategies and technical indicators to aid in trading. Today we would discuss a good strategy used by other traders to aid in their trading The Ultimate oscillator. The is an indicator-based strategy introduced by Larry Williams in 1976.
Just like many other momentum-based indicators, the Ultimate oscillator is used to identify trends, trend reversals, and stop signals to make trade entries. Moreover, the ultimate indicator is also used to identify divergence of the price to make trades. unlike most momentum indicators, the ultimate oscillator combines the short, medium, and long-term price to make an analysis. Hence, the ultimate oscillator gives better predictions than most of the momentum indicators that depend on only one time period to make an analysis.
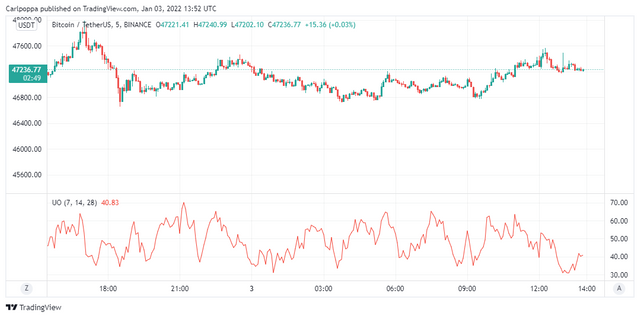
Just like many other momentum-based indicators, the ultimate indicator has a reading that ranges between 0 to 100. The reading describes the current state of the market. In the case of a balanced market where both sellers are buyers are balanced in the market, the Ultimate oscillator ranges around the 50 mark. However, when the reading exceeds the 70 level and above, we say the market asset or the stock is overbought. On the other hand, when the ultimate oscillator ranges between 0 to 30, we say the asset is oversold.
How the Ultimate Oscillator is Calculated
we can use the general formula,
- UO=(((A7 * 4)+(A14 * 2)+(A28))/7)*100
- UO is the ultimate indicator
- A7 is the average using 7 period
- A14 is the average using 14 period
- A14 is the average using 28 period
- A7 = Sum of BP for the past 7 days / Sum of TR for the past 7 days
- A14 = Sum of BP for the past 14 days / Sum of TR for the past 14 days
- A28 = Sum of BP for the past 28 days / Sum of TR for the past 28 days
- BP = Current Close – Min(Current Low or Previous Close)
- TR = Max(Current High or Previous Close) – Min(Current Low or Previous Close)
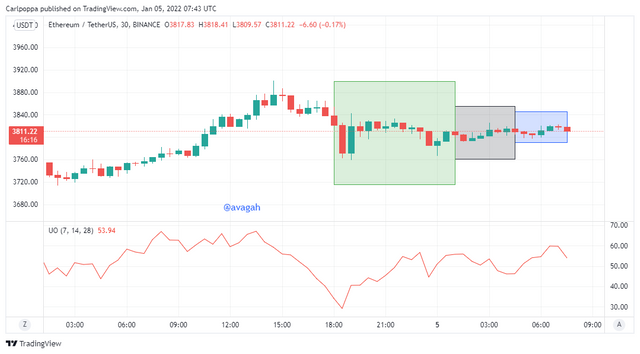
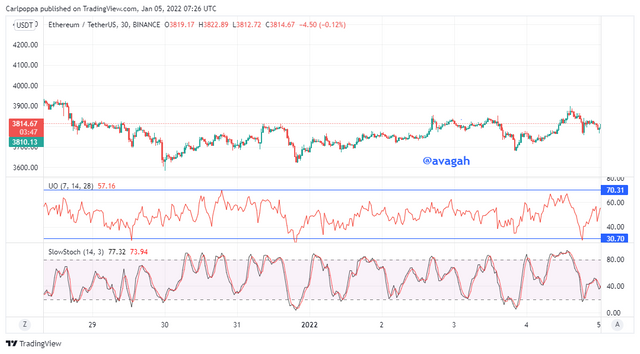
Illustrative Example of ETHUSDT
| n period | BP | TR |
|---|---|---|
| 1 | 6.27 | 8.84 |
| 2 | 5.1 | 10.17 |
| 3 | 7.47 | 9.73 |
| 4 | 12.94 | 21.5 |
| 5 | 6.37 | 9.44 |
| 6 | 8.29 | 12.43 |
| 7 | 7.6 | 10.68 |
| 8 | 12.8 | 16.23 |
| 9 | 2.61 | 8.9 |
| 10 | 10.65 | 24.03 |
| 11 | 5.38 | 10.37 |
| 12 | 5.03 | 15.5 |
| 13 | 0.93 | 13.59 |
| 14 | 5.64 | 11.8 |
| 15 | 18.87 | 20.98 |
| 16 | 26.27 | 32.32 |
| 17 | 2.22 | 27.61 |
| 18 | 11.55 | 21.16 |
| 19 | 10.71 | 15.09 |
| 20 | 6.00 | 17 |
| 21 | 9.64 | 16.16 |
| 22 | 11.13 | 20.95 |
| 23 | 4.95 | 16.73 |
| 24 | 31.9 | 34.21 |
| 25 | 12.31 | 27.81 |
| 26 | 60.34 | 84.12 |
| 27 | 9.34 | 63.61 |
| 28 | 1.01 | 32.73 |
A7 = 45.04 / 82.79 = 0.55
A14 = 97.08/183.12 = 0.53
A14 = 313.31/624.61 = 0.50
substitute all the value of the periods into the main equation.
- UO=(((A7 * 4)+(A14 * 2)+(A28))/7)*100
- UO = (((0.55*4) + (0.53 2) + (0.5))/7)100
- UO = (2.2+1.06+0.5)/7 *100
- UO = 0.537*100
- UO = 53.7
from the chart above, we can see clearly that, the value of the UO is about 52.9 which prove that, our calculation is valid.
How to identify trends in the market using ultimate oscillator. What is the difference between ultimate oscillator and slow stochastic oscillator.
Identifying trends with the Ultimate indicator is very simple. Usually, with momentum-based indicators, identifying trends is very easy. In the crypto market, when the selling force is very strong for a particular period buyers set in to buy more of the asset since the price of the asset had dropped. This causes the market to be in an uptrend. With the Ultimate oscillator, the reading falls within the 0 and 30 range to signal that the asset is being oversold and introduce buyers to buy more of the asset. This causes the uptrend movements of the price.
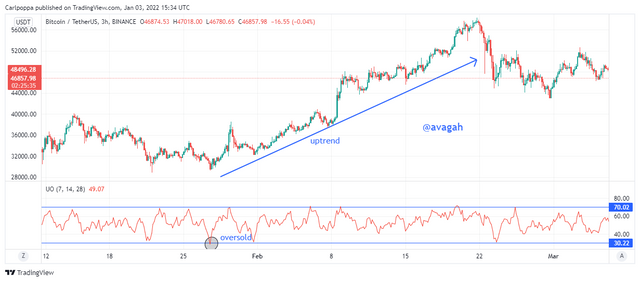
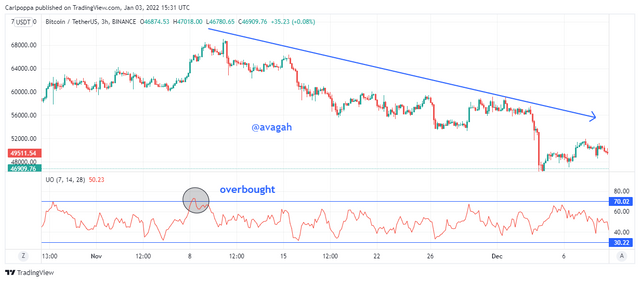
On the other hand, Identifying downtrends is the opposite of the uptrend. With the downtrend, the Ultimate indicator ranges between 70 and 100 to show that the asset is being overbought and hence people start to sell more of their holdings which pushes the prices of the asset to fall. The causes the market to be in a bearish trend since most of the holders are selling their holdings.
Differences between ultimate oscillator and slow stochastic oscillator
| Ultimate oscillator | Slow stochastic oscillator |
|---|---|
| uses 3 different periods to make an analysis. ( 7 period, 14 period, and 28 periods) | Uses only two periods to make an analysis. (the 14 periods and 3 periods) |
| Has only one oscillating line | has two oscillating lines |
| used the 70 and 30 levels as overbought and oversold regions respectively | Uses the 80 and 20 levels as overbought and oversold regions respectively. |
| The ultimate oscillator gives late confirmation compared to the slow stochastic oscillator | Gives early confirmation compared to the ultimate oscillator. |
| Generates very few signals | gives numerous signals |
Aside from these differences, these two indicator works very similarly that's the ultimate indicator can be replaced with the slow stochastic oscillator and work perfectly well. The slow stochastic oscillator uses the crossovers from the indicator as entry signals which makes trading more simple.
How to identify divergence in the market using ultimate oscillator, if we are unable to identify divergence easily than which indicator will help us to identify divergence in the market.
Identifying divergence with momentum-based indicators is very simple. Here, I would demonstrate clearly how to identify divergence for both bullish and bearish divergence.
Bullish Divergence
For a bullish divergence, the price of the asset moves in a bearish trend while the indicator moves in a bullish direction simultaneously. After such movements, the price quickly reverses in a bullish trend causing the bullish divergence. With the Ultimate indicator, the price of the asset would be in a downtrend while the ultimate indicator would be moving in an uptrend. The quick reversal in the bullish trend makes the divergence valid.
Bearish Divergence
For a bearish divergence, the price of the asset moves in a bullish trend while the indicator moves in a bearish trend simultaneously. After such movements, the price quickly reverses in a bearish trend causing the bearish divergence. The ultimate indicator initially moves in bearish movements while the price moves in an uptrend. In that case, we are certain of a bearish divergence.
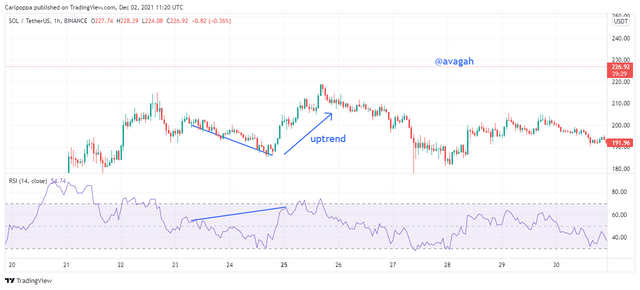
Aside from the Ultimate indicator, we can use other momentum-based indicators to identify divergence to take entries. Although we identified divergence with the ultimate indicator, I think using the RSI, William %R and the Stochastic indicator would be easier.
Identifying Divergence with the RSI
what is the 3 step- approach method through which one can take entry and exit from the market. Show real example of entry and exit from the market.
Taking Entries with the ultimate oscillator is very simple. Here, I would demonstrate clearly how to identify signals to make trades with the ultimate indicator.
Buy trade
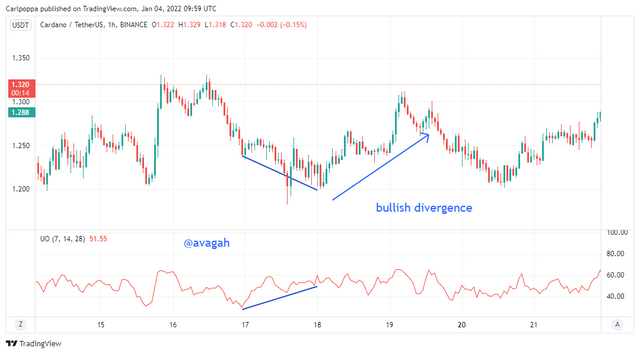
First and foremost, we identify a bullish divergence. This occurs when the price moves in a bearish direction while the indicator moves in a bullish direction
The initial lower low in the price must fall below the 30 ultimate oscillator reading while the price continues to drop and the indicator continues to rise
The ultimate oscillator must rise above the divergence high (the point between two lows of the divergence.)
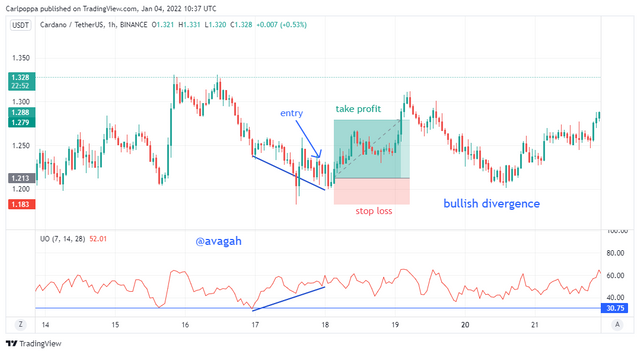
From the Cardano chart above, we can see that the chart satisfies all three conditions. here, we place our buy order when we identify a small candlestick with a wick. This is to give further confirmation that the bearish trend has ended.
Sell Trade
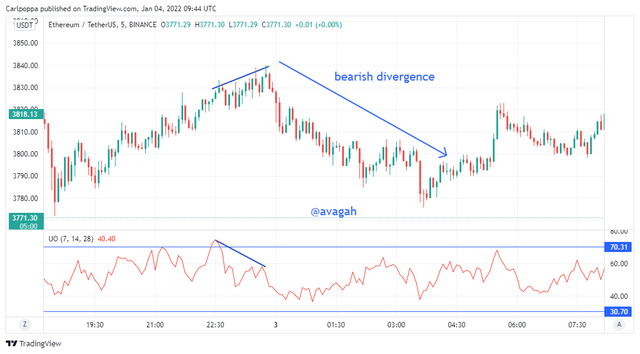
First and foremost, we identify a bearish divergence. This occurs when the price moves in a bullish direction while the indicator moves in a bearish direction
The initial higher high in the price must rise above the 70 ultimate oscillator reading while the price continues to rise and the indicator continues to drop
The ultimate oscillator must fall below the divergence low (the point between two highs of the divergence.)
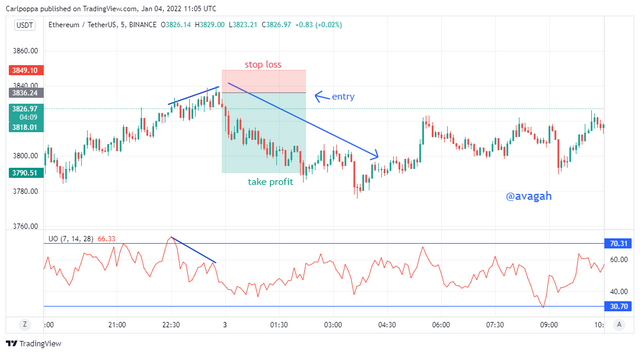
From the ETHUSDT chart above, we can see that the chart satisfies all three conditions. here, we place our sell order when we identify a small candlestick with a wick. This is to give further confirmation that the bullish trend has ended.
What is your opinion about ultimate oscillator indicator. Which time frame will you prefer how to use ultimate oscillator and why?
In my opinion, the ultimate oscillator is a very good indicator that can be used for trading. However, looking at how the indicator works, I still think it should be used alongside other technical strategies or technical indicators to serve as a confirmation before we enter into trade.
From my experience with a technical indicator, they seem to identify signals very late compared to the technical strategies. Although the Ultimate oscillator can be used without any other tool, I still think it best to combine the indicator with other strategies.
Talking about the timeframe suitable with this indicator, I think both scalpers and swing traders can both use this indicator. The ultimate indicator combines three different periods (7,14 and 28 periods) to analyze as such, both scalpers and swing trades can choose their required timeframe which would work perfectly. However, Scalpers have more advantages with the ultimate indicator. In smaller timeframes, you can identify many signals for trading.
CONCLUSION
Trading has become the order of the day. Day in and day out, traders are generating new techniques to improve their skills. With technical indicators, they seem to identify trends very late. However, this particular indicator from the lecture produces a more accurate result compared to other momentum-based indicators and also identifies signals faster than the others.
However, I suggest you use the indicator with other technical strategies like the MSB, BRB, Double tops and double bottoms, etc. The ultimate indicator can serve as a confirmation using the overbought and oversold regions. As we are all aware, no indicator or strategy is 100% accurate. So it is advisable to use multiple strategies at a time to better the trade.
HOW DID YOU GET YOUR BUYING PRESSURE VALUE
Take the candlesticks one after the other and record the corresponding high, low, close, and open. Afterward, use the formula that’s BP = Current Close – Min(Current Low or Previous Close)
Use this for all the 28 candlesticks to find the corresponding BP.
The current close - either the current low or the previous candlestick close price. Depending on the one with the lowest value
wait , you actually did that
Yeah very lengthy
why didnt you use true range indicator
Naaa just raw calculations
E shock you? 😹
I swear
oye bro todo bien pero colocaste al reves los numeros en la suma de los primeros 7 dias de la presión de compra. porque pues colocaste 45.04 y creo que es 54.04 de todas maneras confirma la suma antes de hacer algún cambio.
Okay