5 Ways to Analyze Bitcoin Charts with Bollinger Band Theory
How to analyze Bitcoin chart with Bollinger band theory - Bollinger Band is also called Bollinger line. This line is a pretty good indicator in trading. Many Bitcoin traders believe that this theory could be the key for their trading in order to earn profits. Bollinger a line that is then drawn around the structure of the movement of commodities or shares that are currently traded. The point that matters in the Bollinger band is the price movement on the average, then showing the trend in the medium term or commodity stocks. Bollinger band will also have a period of monitoring. To be able to create opportunities or profits in trading, you must know how to analyze the Bitcoin chart with Bollinger band theory like the following:
Normal Condition Analysis
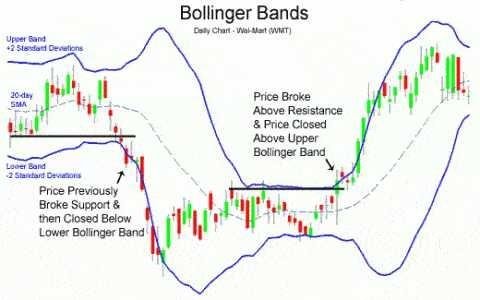
How to analyze Bitcoin chart with Bollinger band theory that can be shown is in normal condition. When a normal Bollinger will be marked with a chart on the band bands tend to be the same at each time. The shape of the band or band is horizontal but not narrow, on a condition also tilted in accordance with the trend that the angle of the slope below 45 degrees. When normal conditions Bitcoin market will run back and forth between band Band. This back and forth can be seen when the market touches the band that is outside the band, then the market will return to the middle. Under normal conditions you can trade with a scalping strategy.
Break
To read the Bitcoin phase break analysis with Bollinger's theory the band can see it on the top of the band, and also below. The distance between the upper and lower ribbons is mutually distant and the distance is so great. The impact of such ribbon conditions will make the Bitcoin market move straight. If this phase occurs then the trend will reverse normally unless convergence occurs. When faced with this phase you can use the breakout strategy.
Break Closure Analysis
Analyze the break closure can be by looking at the Bollingerr ribbon that turns into narrowed. The characteristics of the Bitcoin market chart are horizontal and will contradict the current trend. When this condition occurs you should not do anything until the next signal appears.
Normalization
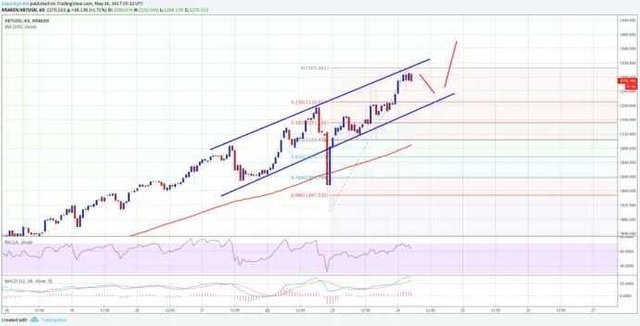
This phase is useful for normalizing the balance and testing the trend. In this analysis the trend strength will be tested. During the normalization phase you will see a horizontal graph then form a wedges pattern. When the normalization conditions are advised not to enter the market Bitcoin.
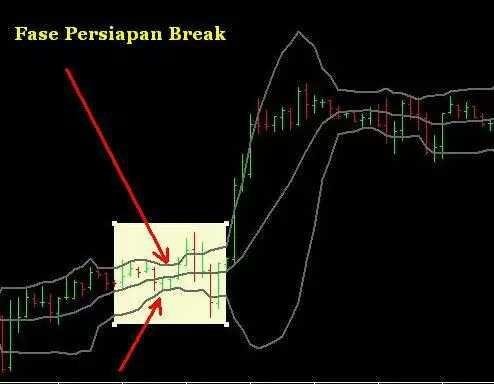
Break Preparation
To analyze the Bitcoin chart as the price prepares for a break is to observe the Bollinger bands. You should always be ready for a Bitcoin break which is due to market conditions being completely deserted. When this market is lonely the seller and the buyer are just waiting for the price of Bitcoin to break. To be able to overcome this condition you can use a strategy of a trap.
Bollinger Bands Indicator Function
Once you know how to analyze Bitcoin charts with Bollinger bands, you now need to know the functionality of the Bollinger bands indicator. Basically Bollinger bands there are two functions that mark the limit Oversold, and Overbought. Many traders using Bollinger bands mark the saturation level of sales. This will happen when the Bitcoin seller is saturated in making the sale. Therefore oversold this will turn into a buyer. When this happens then the price of Bitcoin becomes turned up or up.
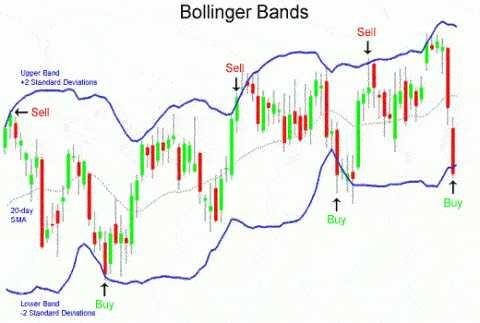
The second function is to overcome overbought. This becomes the opposite of oversold. When traders are saturated buy then that was a buyer then replaced to be a seller. When this happens the analyzed or estimated Bitcoin price will reverse down. This saturation is characterized by bands on Bollinger bands. When the Bitcoin market touches the upper band of the Bollinger band it is a sign of saturation, whereas if the market touches the ribbon at the bottom indicates overbought or price discount.
At first Bollinger bands are used as a measure of the market crowd. But as time goes by, Bollinger bands are used as the next Bitcoin market direction. Therefore Bitcoin traders should know how to analyze Bitcoin charts with Bollinger band theory, and how to use them properly in order to analyze opportunities that then culminate in profit.