How to Trade Using the Parabolic SAR Indicator
Trading with the Parabolic SAR indicator involves leveraging its signals to identify potential entry and exit points in the market. Let's delve into how this indicator can be utilized effectively with a practical example.

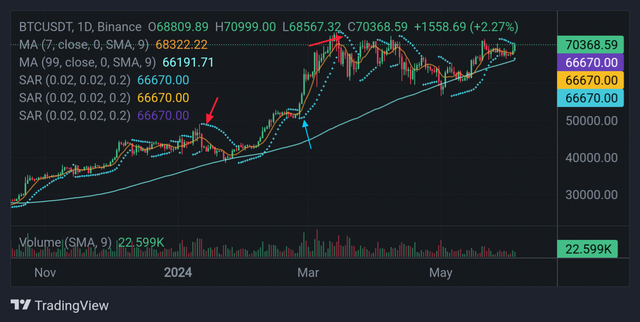
Canvas source Take a look at a real-time price chart of Bitcoin. It shows a phase of consolidation between $66,670 and $70,386. The Parabolic SAR indicator can be a useful indicator for traders looking to profit from fluctuations in the market during this time.
As the price of Bitcoin fluctuates throughout the consolidation zone the two ranges from last 3 month i guess , the Parabolic SAR clearly illustrates possible opportunities of entry.
For example, a bullish trend can be determined when the indicator's dots are placed listed below the price candles.
Traders that expect more upward momentum in the market might interpret this as a buying opportunity.
 TradingView TradingView |
|---|
If, on the other hand, the dots move from below to the one above the price candles, this could indicate a negative trend or possible inversion. To profit from downward market swings in these kinds of situations, traders may think about closing long positions or even starting short bets.
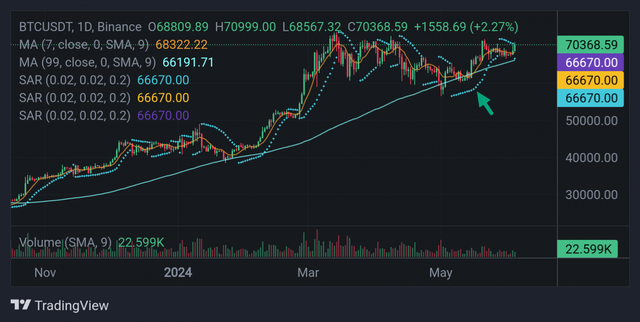
Assume for the objective of this example that the Parabolic SAR indicator produces a positive signal when the price of Bitcoin gets closer to $66,670, which is the lower bound of the consolidation range.
 TradingView TradingView |
|---|
Traders who see this indication may choose to open a long position in anticipation of the rising trend continuing.
The Parabolic SAR keeps giving orientation as the price progressively rises throughout the consolidation stage from modifying its position in response to the price movement.
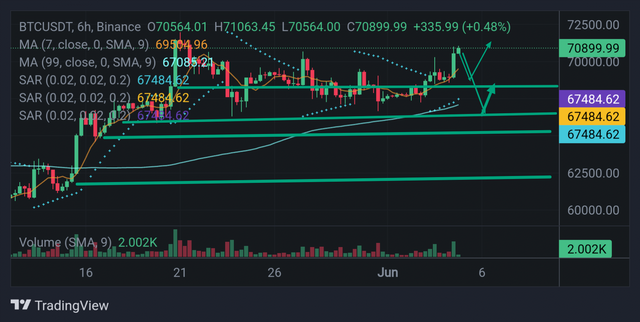
A possible reversal or tiredness of the bullish momentum may be indicated by the A parabolic SAR when the expense gets closer to the upper bound of the consolidation range which is $70,386, showed in the screen shot .
 TradingView TradingView |
|---|
Traders that pay attention to this signal can decide to cut their long positions in order to lock in profits before a correction or reversal happens during the market.
On the other hand, if aggressive traders mostly like investors are of the opinion the price of Bitcoin is going to drop substantially, they might even think about initiating short positions.
Welles Wilder, a well-known technical analyst who additionally brought about the Average True Range (ATR) and the Relative Strength Index (RSI), designed the Parabolic SAR (Stop and Reverse) indicators.
The goal of the Parabolic SAR, which was initially put forward in his 1978 book "New Concepts in Technical Trading Systems," is to pinpoint market entry and exit locations as well as anticipated trend reversals.
Because of its distinctive calculation formula, which modifies the indicator's her rejection when compared to price activity, traders in a variety of financial markets can benefit from using it.
- Conclusion
In conclusion the trading with the Parabolic SAR is essentially a constantly changing relationship between the signals provided by the indicator and the state of the market.
Through consistent observation of the Parabolic SAR in conjunction with other technical indicators along with fundamental elements, traders can more comfortably and effectively navigate the complicated terrain of the cryptocurrency market and make well-informed judgments.
Kind Regards
@artist1111

Adieu, folks!
May the winds of fortune
carry you to greatness!
May the winds of fortune
carry you to greatness!
X-promo : https://twitter.com/HamadkhanMWT/status/1798074858804548002?t=n1ZgjfbZT8lGbAnSnXSilQ&s=19
Note:- ✅
Regards,
@jueco