Decoding bTC/Usdt market sentiments
 |
|---|
Greetings to everyone in Steem Alliance and others visitors. This is me @artist1111 once again . Today, I am once again going to discuss the market sentiments by understanding the price action of BTC across different time frames and closely take a look by volume which makes idea clear.
I am pretty sure that this analysis will provide pretty good highlight the current BTC/USDT market sentiment on 24/06/2024 and potential future movements.
Let's don't wait, jump in by first looking at the daily time frame, then take a look of volume , and finally the 4-hour chart.
 TradingView TradingView |
|---|
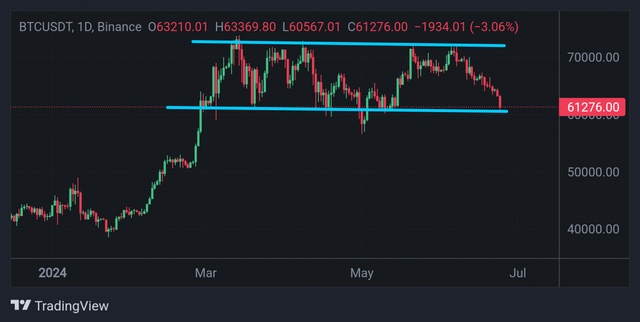
Dear friends take a look a daily time frame where the current price is 61,276.00, down by -3.06%.Here we noticing a bearish sentiments in the chart that Bitcoin has been in a downward trend since mid-April. To be honest for it was highly correction was expected .
We have also witness that the price has broken below the key support level around 63,000,and the alarming thing was that it had tested multiple times before. This tested was ambiguous but it some how suggests a bearish sentiment as sellers have gained control.
Here it is also highlighted a potential support zone around 60,000, which is a critical level to watch for saveral reason, how? Lets discuss in the down chart .
 TradingView TradingView |
|---|
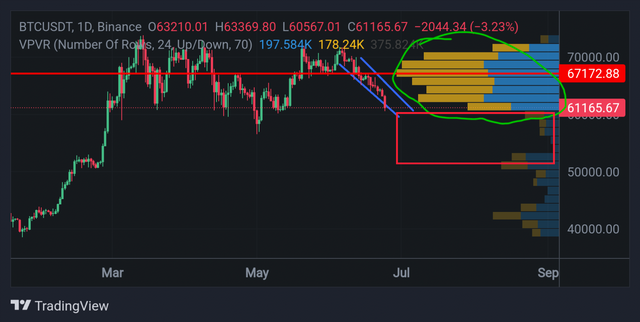
Have a look to a Btc/Usdt volume from 61000 to 72000 in the chart . The current price is 61,165.67, down by -3.23%. The above volume shows a high volume node around 67,000, indicating strong resistance at that level since its already break .
Below in the chart the current price, the volume drops significantly until around 54,000, suggesting that if the price breaks below 60,000 mean breaking if this volume , it could fall rapidly to the next support which is 57000 and so on to 54000$.
This vary volume areas highlight where the most trading activity has occurred i mean from 61000 to 72000, which often acts as support or resistance.
 TradingView TradingView |
|---|
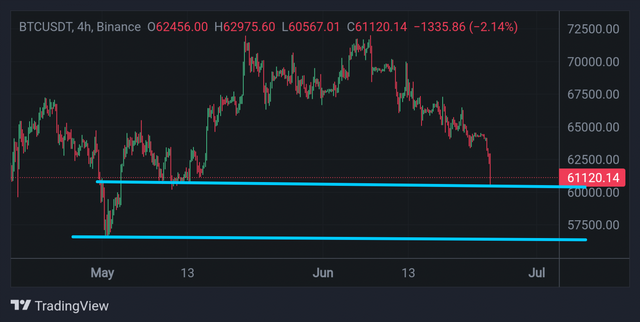
When i opened this chart i don't surprised, I just looked at the 4-hour time frame, where BTC/USDT is trading at 61,120.14, down by -2.14%. The 4-hour chart shows a sharp decline, with Bitcoin breaking below the previous support of around 62,500. This indicates a continuation of the bearish trend seen in the daily 4h charts.
The immediate support now lies around 60,000, and if any case this level fails to hold, it could signal further downside probably towards 57000.
We need to wait for daily close then picture will be clear, however the week close by bearish and selling pressure .
Dear friends he break below key support levels on the daily and 4-hour charts suggests that sellers are more active then buyer that's how market collapsed. The volumes shows strong resistance around 67,000 and a potential fast decline if the price falls below 60,000. Therefore, we need be cautious wait at least for daily closing and watch for how the price reacts at the 60,000 support level. Simple is that , If it holds, there could be a potential bounce, but if it breaks, further downside is likely✊.
Note : This post is made for educational purpose and not a financial advice.
Kind Regards
@artist1111

Adieu, folks!
May the winds of fortune
carry you to greatness!
May the winds of fortune
carry you to greatness!
X-promo : https://twitter.com/HamadkhanMWT/status/1805215318949716227?t=DM2mlqn6qPkeuglDEEam5A&s=19
Note:- Your post is lacking a detailed explanation on its topic, please give more explanation to your post
Regards,
@jueco