Moving Charts: BTC Value Per Coin Analysis | 10% To @tron-fan-club
Hello everyone and welcome to everyone at Tron Fan Club. To our delight, the market has seen some positive signs over the past few weeks. Throughout the market, there have been uptrends. But a correction and some consolidation became inevitable. And it is no different for BTC as well. So, we saw BTC fluctuate a lot under the strong resistance zone. Today we will look at the price movements of BTC and reflect on where it could go next.

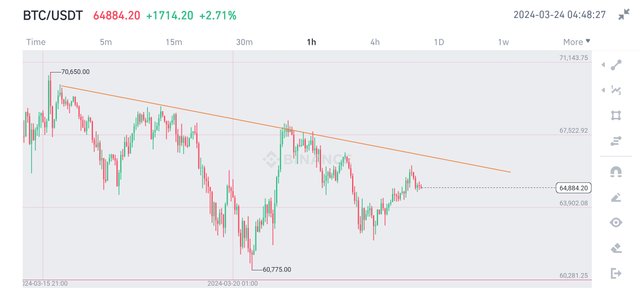
Last week, the King of Cryptocurrencies, BTC was hovering around 66300$ level. BTC was on uptrend for weeks. But this week was a bit different. It was a week of correction. BTC made swift moves and even came down to 61100 before bouncing back. A crucial thing that can be noticed on the chart is the bearish trendline that BTC created last week. This trend is pushing BTC to downside.
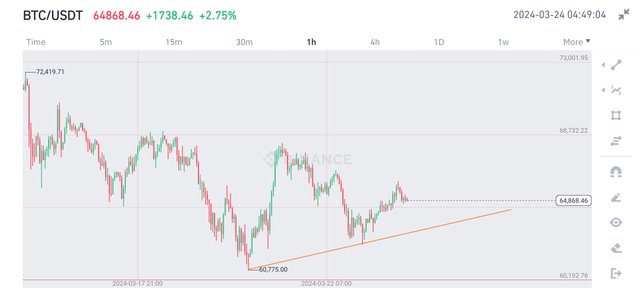
After the bounce at the sub 61k zone, BTC went up to the 68000$ level. After that, it started to lose out strength and so came down again. Currently, it clear that BTC needs to hold onto the trendline shown above and break through the week-long bearish trendline that it created. It is now at 64800$. This is ultimately a 2.1% lose in value over a time span of seven days.
All Screenshots are taken from Coingecko
No words from this article should be taken as financial advice.
Thank You for reading.
VOTE @bangla.witness as witness

OR

https://twitter.com/Arsalaan00070/status/1771674883467985190?t=2dlUfca07BxVejsO74abHQ&s=19
Nice update you have shared on the value of bitcoin per value, like your exceptional analysis
Tried my best analysis possible outcomes. You are always welcome!
Nicely analyzed the value of BTC with other coins. I think BTC may pump more in April.