Moving Charts: BTC Value Per Coin Analysis | 10% To @tron-fan-club
Hello everyone and welcome to everyone at Tron Fan Club. The market has once again risen and now very volatile than ever before. The market can neither be marked as bullish nor bearish. It can be identified as "Range-Bound" market if we observe the last seven days actions.

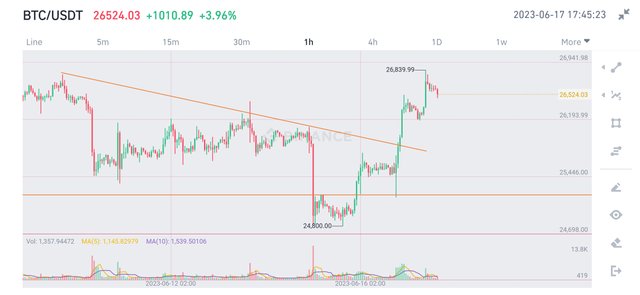
So for the past week, bitcoin has faced ups and downs, like always. You'll see the level of volatility it has shown over this past week. It clearly has no idea where it is headed to. After losing the support in the sub 27000$ zone, the price fell suddenly to the next support level of 25000$. It held greatly and now moving towards the 27000$ zone again to test its strength.

As you can see, it started its downward trend from 9 June falling from ~ 26500$ to 24800$. But eventually it broke through the trend line and increased 500$ in price within only one hour. Many availed the chance to buy the Digital Gold when it fell under 25000$ and so it jumped back almost in an instant. It is clearly evident that the actions of SEC lead the fall of price. However, Bitcoin maxis don't stop so easily.
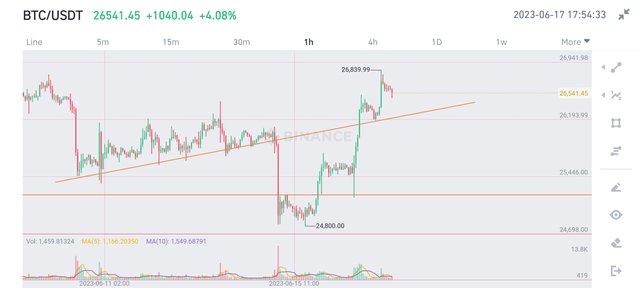
After breaking through the trend line, the move was almost vertical and reached the resistance level of 27000$ and tested its strength. The unsuccessful attempt to break that line has lead to a temporary downfall of price.

Now, as we look into the 1-hour RSI and MACD, it seems like the bears have the opportunity to take the momentum again. The RSI is at ~55 and falling from a overbought space. MACD is alse having a bearish cross. The overall situation doesn't look good.
But we have to keep in mind that BTC always love to show surprises. What you expect is expected not to be happen. Yeah, BTC is just like my previous sentence, a paradox.

After touching the resistance line and it is very likely that BTC is going to atleast make a double top if not breaking the resistance. So I believe bitcoin is going to touch the trendline shown in the last chart and then start its probable another attempt to break sub 27000$ level. If it fails do so, we may again head towards the trendline and if that breaks, be ready to welcome 25000$ again.
All Screenshots are taken from Binance
Nobody knows what's coming next. My prediction is BTC is going to fluctuate in the 25000$-27000$ zone for some time until some good or bad news shows up. Market is very volatile right now as it has always been. So, if you are investing or trading, be always cautious. No words from this article should be taken as financial advice.
Thank You for reading.
VOTE @bangla.witness as witness

OR

I am glad to see Your this post. This is an informative post for everyone.
Thanks for taking time to read my post!
Thank you for giving this detail explanation on the moving value of btc, we appreciate your work 😊
Happy to share my thoughts! Thanks!