Moving Charts: TRX Value Per Coin Analysis | 10% To @tron-fan-club
Hello and welcome to everyone at the Tron fan club. Another week has gone by, and today again we take a look at TRX, Tron for the Tron Fan Club. This last week has been hard for the token, given how the market has reacted towards the end of the week. Let's dissect the price movement of TRX.

Made with Canva.
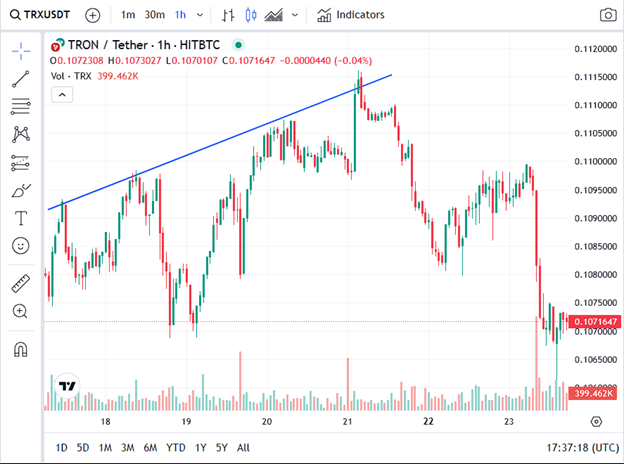
Last week TRX was being traded at some 0.108$. It was the continuation of a small uptrend that had been going on for a few days at that point. While posting higher highs consistently, in 4 days, at the beginning of the 21st of January, TRX reached the 0.1115$ margin. It could have gone higher, but this progress was hindered.
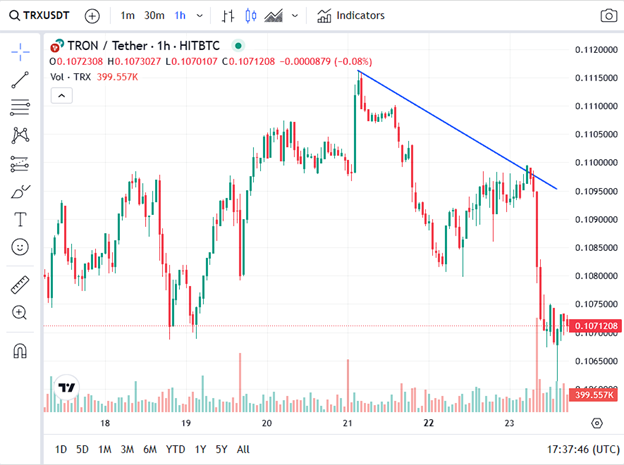
The progress was hindered by the overall crash the market has been facing over the last 2-3 days. As a result, TRX never went upwards of 0.1115$, and it drastically fell down to 0.108$. Then there was a small reversal as TRX returned to 0.110$. But then today the market has been bleeding again, and as a result, TRX has fallen down to 0.107$
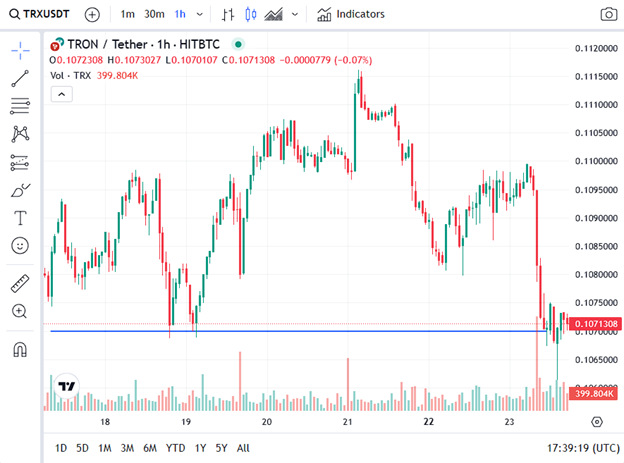
Now if we see qt the chart then we will see that TRX has touched the 0.107$ about three times. This shows that 0.107$ is a strong support margin. So even though TRX has gone under 0.107$ once, and is looking to fall down again, we can at least expect that there will be some sort of reversal, which will hold TRX together.
All Screenshots are taken from Coingecko
No words from this article should be taken as financial advice.
VOTE @bangla.witness as witness

OR

https://twitter.com/Arsalaan00070/status/1749865305290231887