Moving Charts: BTC Value Per Coin Analysis | 10% To @tron-fan-club
Hello everyone and welcome to everyone at Tron Fan Club. The last week has been rather dull for BTC. Compared to the gains we have seen by the leading crypto token over the past month, this week hasn't been kind for it. As a result, there is an overall downturn in the valuation of the token.

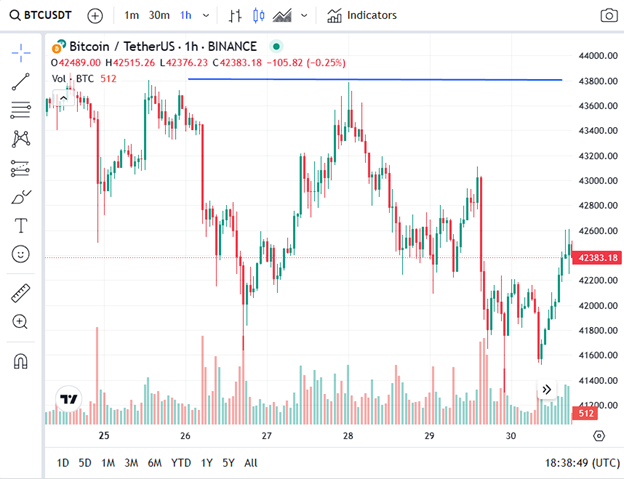
If we look at the chart we will see that a week ago BTC was being traded at 43660$. There was an overall target of BTC reaching 44000$ in valuation. And as it seems, the resistance is very stiff. As BTC struggles to achieve it. And the aftermath is in front of you.
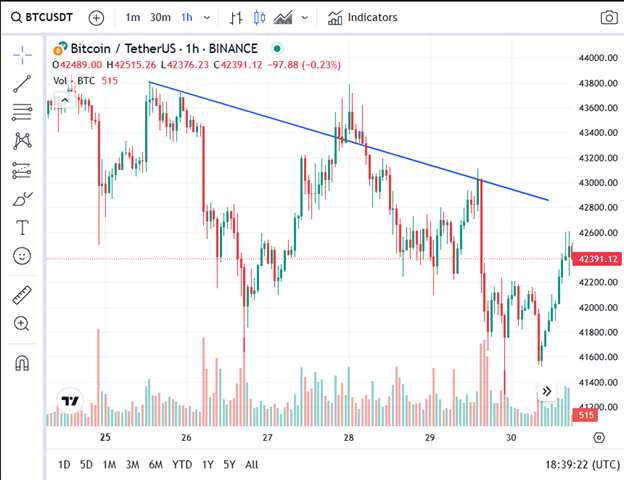
After a couple of attempts (recorded this week) of BTC trying to reach 44000$, it was denied any headroom above 43800$. Due to this BTC eventually went down. And as you see eventually BTC is hovering more towards the 42000$ mark now.
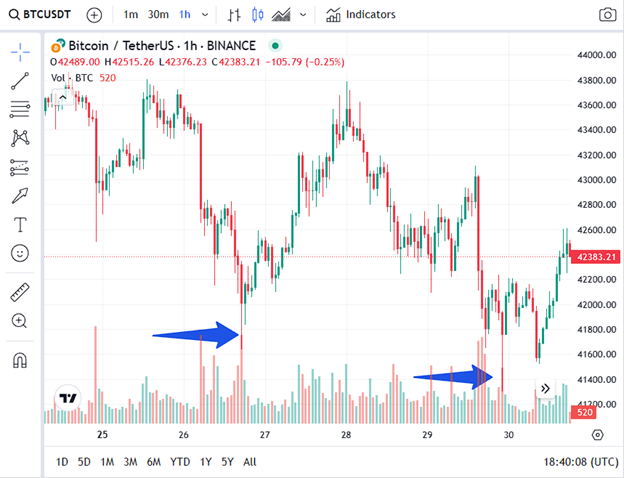
This downfall could have come more lightly. But it was facilitated by two dumps which followed right after BTC tried to break 43800$ and 43000$ after going down. These took BTC down to 41500$ or lower. Thus there has been a lot of ground to cover to get back to where BTC was a couple of weeks ago.
All Screenshots are taken from Coingecko
No words from this article should be taken as financial advice.
Thank You for reading.
VOTE @bangla.witness as witness

OR

Nice analysis you have shared on bitcoin, for a fact I know we will see nice price action from bitcoin latest the later part of next year
Your analysis of the BTC chart is excellent. Great job
https://twitter.com/Arsalaan00070/status/1742244131613876632