BTC. Looks promising. 2W graphics volumes are impressive
Greetings dear subscribers!
Well, the time has come for a new analysis of the situation for BTC. Moreover, there is something to tell, because interesting events are taking place.
Theses:
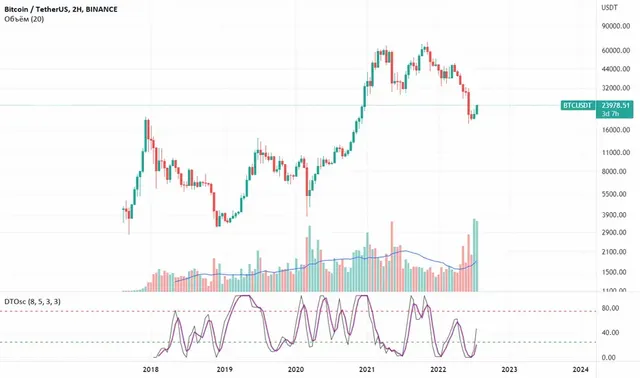
Just look at the volumes of buyers 2W chart
Was it really the bottom, or was it not quite there yet?
What's going on in the fund?
Geopolitical risks today
Europe will drive us all into ... it will be hot)
Summing up the analysis
Just look at the volumes of buyers 2W chart
I specifically made one chart with a 2 week timeframe for you to enjoy these really epic buying volumes. You can't even really compare them to anything. These are the largest volumes of buyers for the last 1771 days (almost 5 years!). No comment... )
Was it really the bottom, or was it not quite there yet?
It is still difficult to say with certainty that this means a reversal, but we are definitely somewhere nearby. What are the options for the development of the situation? We can bounce back to 30,000 and bottom again, starting a double (maybe triple) bottom. We can bounce to 30,000 and go to form the 5th wave after the ABC correction, reaching all the same up to 11,000 - 13,000. The option of going straight up from the current ones, I give little chance. Why will become clear later.
What's going on in the fund?
Focusing on the index DJI. We bounced off the MA100 on the weekly chart and are moving towards the 33,000 area. Potentially, we will grow until the end of August. Slowing growth on weekly candles will make it clear when the growth ends. The body of the candles will start to get smaller. On the MACD, the histogram will also show a halt in growth and begin to weaken.
It seems to me that we are repeating not just a fractal, but a fractal of the 2008 crisis (I showed the chart in my cart in more detail). Only in the current case, we still have geopolitical tensions on the brink of nuclear war as a plus (I hope these are just my fears).
Europe will drive us all into ... it will be hot)
Potentially, I see the European market as a trigger, which expects an energy "ravine" (it's hard to call it a pit) in winter. Heavy industry enterprises will stand up, the market will react at a peak. Where European pragmatism has gone, one can only guess.
The American and European economies are strongly tied to each other. Shake DJI will. It is quite realistic that we will see it at 17,000 points. This is also confirmed in his recent tweet by Michael Burry (we don't believe the word, always look at the chart).
Summing up the analysis
I focus more on the movement of the stock market. The crypto is heavily tied to it. Nothing good is expected from the stock market. In addition to military/political/economic difficulties, an artificially created problem with energy resources has also been added. The situation is more than man-made.
The most likely scenario I see is with a bottom update and a reversal through the GIP or a return to 18,000 as a second/third bottom. Now I see a local growth to 30,000 - 33,000 (most likely through some thread of the insidious ABC formation, be careful).
If we reach the 30,000 area without a visible correction structure and signs of a reversal from this level, and the stock market consolidates above MA25 on the 1W chart and continues to grow, we will have to admit that a reversal has occurred.
These are the thoughts today. I hope they will be useful to you =) Profit to all!
Thanks for using steemegg
and thank you