BTC TA for 07/11/2019
THIS POST WAS WRITTEN BOTH IN PORTUGUESE AND ENGLISH LANGUAGES. FOR THE ENGLISH VERSION, PLEASE KEEP SCROLLING DOWN THE PAGE!
PORTUGUESE VERSION:
Boa tarde Steemians, tudo bem?
No post de hoje eu irei fazer uma outra análise técnica do preço do BTC, usando como base a ferramenta clássica das médias móveis exponenciais, linhas de suporte e resistencia e também círculos fib.
Para realizar essa análise, eu utilizei a visualização dos gráficos de velas da Binance do período de 1 dia, juntamente com as curvas das médias exponenciais de 7, 20, 30, 50 e 120 dias e os círculos fib. Dessa maneira eu tenho uma abrangência maior para poder fazer uma análise de maneira mais segura com uma série histórica maior.
As médias móveis exponenciais são as médias de preços para um determinado período de tempo, sendo que o período mais recente tem maior peso na construção das curvas. Dessa maneira, além de prover uma visualização de uma tendência elas reagem mais rápido ao se levar em conta a volatilidade dos preços do mercado no curto prazo.
Média Móvel Exponencial de 7 dias (EMA 7): cor azul escuro
Média Móvel Exponencial de 20 dias (EMA 20): cor verde claro
Média Móvel Exponencial de 30 dias (EMA 30): cor amarelo
Média Móvel Exponencial de 50 dias (EMA 50): cor vermelho
Média Móvel Exponencial de 120 dias (EMA 120): cor azul turquesa
Canal de tendencia: linhas lilás
Suportes/Resistencias: linhas brancas
Vamos lá!
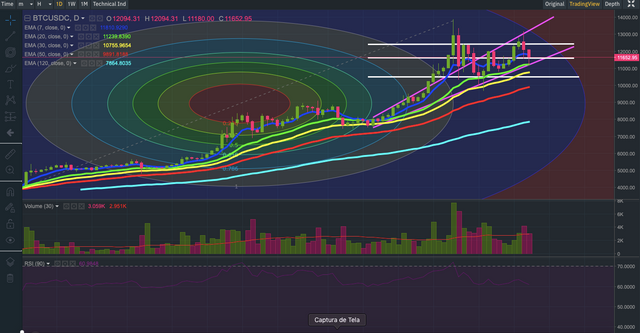
Fonte da Imagem: binance.com
Como podem observar nessa imagem (do período de 02/04/2019 até 09/07/2019), pudemos observar uma clara tendência de alta nesse período (indicado pela curva positiva nos preços). Nesse período o preço saiu de USD$ 4.857,29 (no dia 02/04) para os atuais preços de USD$ 11.617,00, perfazendo assim um ganho de 139,16% no período.
Além disso, como já mencionado anteriormente, observa-se uma curva positiva no ganho de preços da moeda (apesar de uma lateralizacao do mercado que é observada entre 15/06 e 16/06.
Adicionalmente para corroborar essa minha teoria de que estamos em bull market no longo prazo, se observamos os círculos fib, o mesmo se encaixa perfeitamente nos ciclos de ganho exponencial de preços, bem como as linhas de tendência e também de suporte e resistências observados (linhas lilás).
Quando falamos de médias móveis exponenciais, vemos também que durante esse período a EMA 7 sempre se manteve acima das demais (chegando a tocar na EMA 20 apenas no dia 16/04/2019). Normalmente quando a EMA 7 se encontra acima das demais de maneira consistente como se observa no gráfico, isso é uma indicação clara de aumento de preços no mercado. Outro indicador que suporta essa teoria é o volume das transações que teve um aumento significativo desde o dia 21/06/2019.
Os principais suportes e resistências que eu marquei nesse gráfico são os seguintes:
Suporte/Resistencia 1: USD$ 10.821,18
Suporte/Resistencia 2: USD$ 12.041,13
Suporte/Resistencia 3: USD$ 12.465,46
Já no caso de uma reversão de tendencia (para uma tendencia de queda nos preços do BTC, temos os seguintes suportes e resistências:
Suporte/Resistencia 1: USD$ 9.336,00
Suporte/Resistencia 2: USD$ 8.779,00
Suporte/Resistencia 3: USD$ 8.063,00
Em relação aos círculos fib, eles demonstram possíveis ondas e mudanças de comportamento do mercado e são excelente ferramentas para traders se basearem e saberem de antemão quando possíveis correções e mudanças de direção no preço ocorrerão (assim como ocorreram no último dia). No fib desse gráfico, ele indica que o próximo círculo se encontra entre o meio e o final do mês de Agosto. Portanto caso o mercado se mantenha com essas condições, teremos 1 mas de shorts e longs que podem ser bem sucedidos.
Portanto eu continuo bullish no longo prazo e creio que chegaremos no patamar de USD$ 14.000,00 antes que possamos ter alguma correção significativa de preços nesse mercado.
Você gostou desse conteúdo? Por favor me ajude a manter posts com qualidade e regularidade, doando qualquer quantia em BTC, ETH ou Doge para uma das carteiras abaixo.
BTC wallet

ETH wallet

DOGE wallet:

STEEM wallet: @aotearoa
SBD wallet: @aotearoa
Juntos nós podemos fazer com que o #Steemit cresça ainda mais forte e mais rápido!
Posts Recentes:
1984 de George Orwell da vida real (George Orwell's 1984 from real life)
ENGLISH VERSION:
Good afternoon Steemians, how do you do?
In today's post I will make another technical analysis of the price of the BTC, using as base the classic tool of exponential moving averages, support and resistance lines and also fib circles.
To perform this analysis, I used the visualization of the Binance candle charts for the 1 day period, along with the exponential averages of 7, 20, 30, 50 and 120 days and the fib circles. In this way I have a greater scope to be able to make an analysis more safely with a larger historical series.
The exponential moving averages are the price averages for a given period of time, and the most recent period has greater weight in the construction of the curves. Thus, in addition to providing a view of a trend, they react faster by taking market price volatility into account in the short run.
7 day Exponential Moving Average (EMA 7): dark blue color
20 day Exponential Moving Average (EMA 20): light green color
30 day Exponential Moving Average (EMA 30): yellow color
50 day Exponential Moving Average (EMA 50): red color
120 day Exponential Moving Average (EMA 120): turquoise blue color
Trend channel: lilac lines
Support / Resistances: white lines
Let's go!
Image Source: Fonte da Imagem: binance.com
As you can see in this image (from 02/04/2019 to 09/07/2019), we were able to observe a clear upward trend in this period (indicated by the positive price curve). In that period, the price went from USD $ 4,857.29 (on 02/04) to the current prices of USD $ 11,617.00, thus giving a gain of 139,16% in this period.
Moreover, as already mentioned above, a positive curve is observed in the price gain of the currency (despite a lateralization of the market observed between 15/06 and 16/06.
In addition to corroborating my theory that we are in the bull market in the long run, if we look at the fib circles, it fits perfectly into the cycles of exponential price gain, as well as the trend lines as well as the support and observed resistance lines lilac).
When we speak of exponential moving averages, we also see that during this period the EMA 7 always remained above the others (reaching EMA 20 only on 04/16/2019). Usually when EMA 7 is consistently above the others as shown in the chart, this is a clear indication of market price increases. Another indicator that supports this theory is the volume of transactions that had a significant increase since June 21,
The main supports and resistances that I marked in this chart are the following:
Support / Resistance 1: USD $ 10,821.18
Support / Resistance 2: USD $ 12,041.13
Support / Endurance 3: USD $ 12,465.46
In the case of a reversal of trend (for a downward trend in BTC prices, we have the following supports and resistances:
Support / Resistance 1: USD $ 9,336.00
Support / Resistance 2: USD $ 8,779.00
Support / Resistance 3: USD $ 8,063.00
In relation to fib circles, they demonstrate possible waves and changes in market behavior and are excellent tools for traders to rely on and know in advance when possible corrections and changes in price direction will occur (as a small correction have occurred in the last day). In the fib of this graph, it indicates that the next circle is between the middle and the end of August. So if the market stays with these conditions, we will have 1 but shorts and longs that can be successful.
So I remain bullish in the long run and I believe we will reach USD $ 14,000.00 before we can have any significant price correction in that market.
Did you like this content? Please help me keep posts with quality and regularity by upvoting this post or donating any amount in BTC, ETH or Doge to one of the portfolios below.
BTC wallet
ETH wallet
DOGE wallet:
STEEM wallet: @aotearoa
SBD wallet: @aotearoa
Together we can make #Steemit grow even stronger and faster!
Recent Posts:
1984 de George Orwell da vida real (George Orwell's 1984 from real life)

ptgram power: | faça parte | grupos | projetos | membros |
| ptg shares | trilha premium | fórum externo | fórum na blockchain | siga: | @brazine | @brazilians | @camoes | @coiotes | @dailycharity | @imagemvirtual | @msp-brasil | @ptgram-power | @unitedpeople |