Steemit Crypto Academy Season 3 Beginners' course – Homework for Week 3: (All about Trends, Supports and Resistances and simple chart patterns) for Professor @lenonmc21 by @aniksikder
HOMEWORK BEGINNER'S COURSE WEEK 3 (All about Trends, Supports and Resistances and simple chart patterns)
CRYPTO PROFESSOR: @lenonmc21
INTRODUCTION

Hello Professor sir @lenonmc21, thank you for this great and educative lecture. I am going to attend your second class. Sir I really enjoyed your first class and I had some mistakes I tried then to learn and in today's new session I will try my best to this class. Honestly I enjoy your class very much because today I will be able to learn one thing in a new way in the hope that in the world of cryptocurrency investing and we can acquire the appropriate knowledge to start this business in today's class. Today I will share with you my homework Season 3 beginners' course Week 3- All about Trends, Supports and Resistance and simple chart pattern. I arrive with week 3 of the beginners course. I hope the next one is a comfortable read for you and thanks to teacher @lenonmc21 for class.
QUESTIONS
Define in your own words what is a "Trend" and trend lines and what is their role in charts?
Explain how to draw an uptrend line and a downtrend line (Show a screenshot of each).
Define in your own words what "Supports and Resistances are and how we can identify both zones (Show a screenshot of each one).
Explain in your own words at least 2 simple chart patterns with screenshots.

Question 1- Define in your own words what is a "Trend" and trend lines and what is their role in charts?
Crypto trend is a special acquaintance and those who have traders here will hear this name in various ways. The term trend is actually very familiar which literally means going from one end to the other and it is a huge medium for investing in different trend. Traders use the trend very easily in their intelligence because here the price goes from one side to the other which makes them feel comfortable to invest money. Below are some of the assets that should be used for sale and there are several asset agreements for each of its trades.
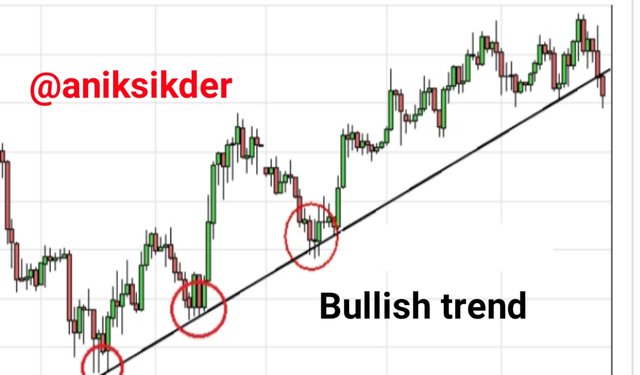
Bullish Trend:
The current market trend is discussed and it is moved to define the market in different ways. For him it is easy for any trader to understand when the market is buzzing that the price of the asset has increased a lot. The bullish trend is an industry in which market assets and industry prices can be shown in BD and the confidence of the various investors who are there can be easily identified.
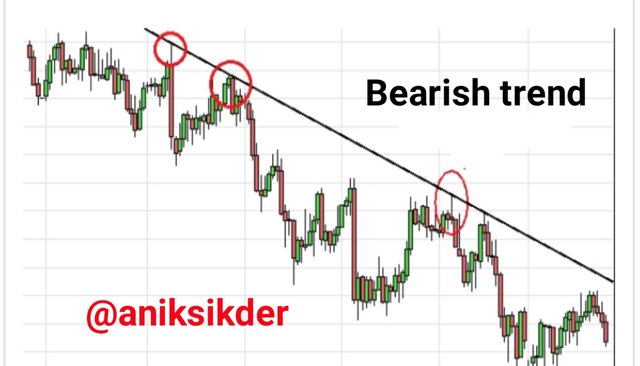
Bearish Trend:
The bearish trend in the crypto market is the main target of various stock and asset prices in the industry and various trends can be defined here. Here at different times in the market the price suddenly rises and the charge that is there goes down a lot and when the trend chart goes down it is very easily identified.
Trend lines
Trendline is very important functionality as current business tools and gets all the overview in the market. Here different traders can find everything they need in time. The trend line is basically a line drawn down here to show the main line, the trend lines are supported in different ways in a frame and they are very easy to price and show different directions over time. By trend line we mean the single line that indicates the data fit for use.
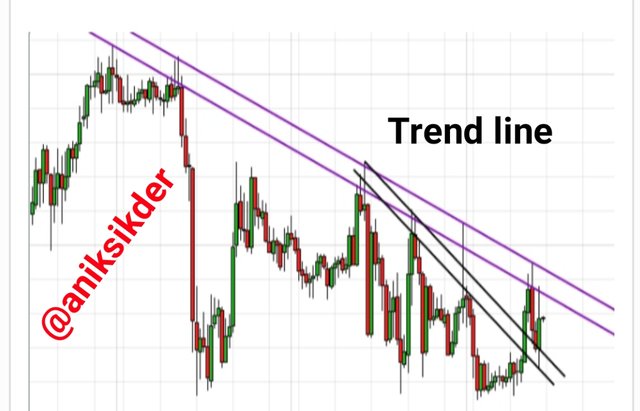
Different charts can be applied here can be analyzed in different ways and the different points created by the train line vary considerably in terms of business. So the value of investing can be seen through the trend line for a trader to have a good idea and understanding. Traders in the trend line usually have to wait for different pricing because the business reviews their risk and bullish and bearish as discussed above and technically they are able to easily observe and manage the directions through the trend line in different ways.
Question 2- Explain how to draw an uptrend line and a downtrend line (Show a screenshot of each)
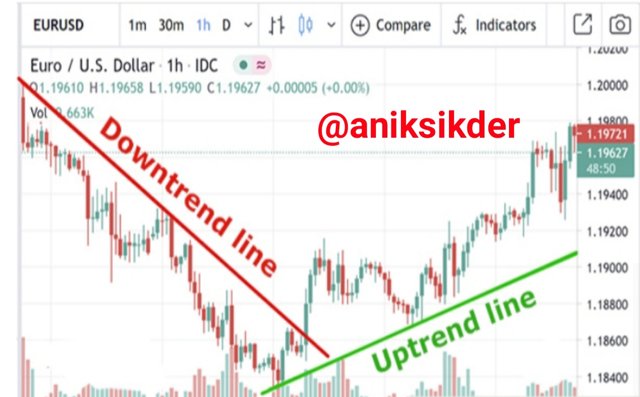
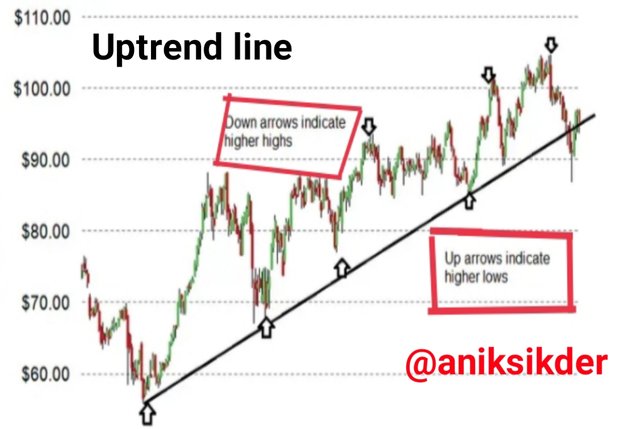
Uptrend line:
The uptrend line is usually we do not have money on the top right and here are connected in a straight line or even lower points in different ways in the tendency of which the second lower for the line must be greater than the first. If we look at uptrend lines as support they point in different ways and as prices go up they supply in different ways just to meet the demand as long as they have demand for the trend line they stay above the train line. We can see more uptrends in different ways as they indicate a break down and they change trends in different ways. If we calculate as above, the trend lines are very effective in identifying whether the trend is intact in different ways and is appearing in different places, and in this case, even if a new train is about to start, the trading tag has to be changed accordingly.
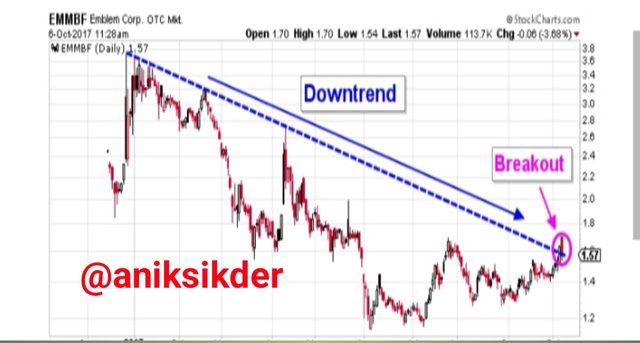
Downtrend line:
The downtrend line we see in different ways is a straight line drawn down to the right that connects the line or two or more high points in different ways. Inside this line if we notice a downward trend which may be less than the second source the first so the downtrend lines are usually represented in the combination of down and down. This we can say is a combination of uptrend line and downtrend line they tell you two things through different charts. For example, if I explain to you, firstly, it gives you a detailed range of where the stock will be valued in different ways, and secondly, it tells you whether the previous characters by traders in different ways and changed in different ways.
Question 3- Define in your own words what "Supports and Resistances are and how we can identify both zones (Show a screenshot of each one)
Today's world there is a lot of technological analysis and traders are helped to resist the tools and supporters in different ways so in the worst case of traders they will see the market in different ways. What can be their price and support and resistance can be the main reason. So we can analyze the different resistances and supports based on the above writing.
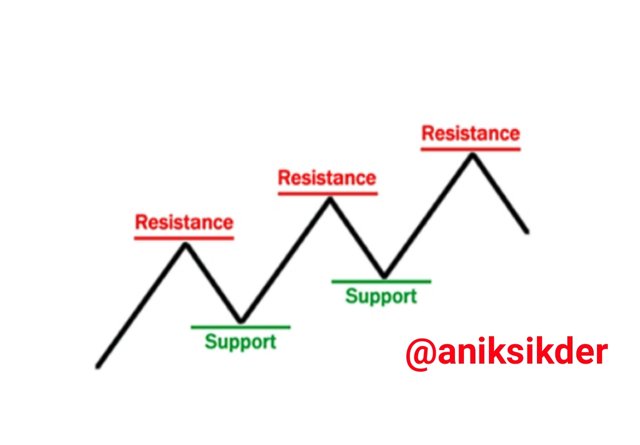
Supports:
Support is very important because if the price goes down for a certain period of time there is a reverse trend and I think it is like an asset that is in a downtrend and there are different demands and strengths for everything that can start rising right now and it has a lot of support. Here also cryptocurrencies for sale in different angles are available and varied depending on your country and the method of payment.
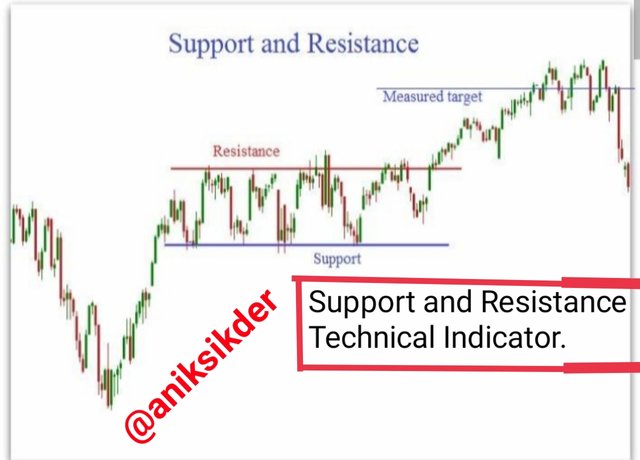
Resistances:
In the case of resistance we can easily understand that the price reaches a place where the demand for supply spreads and this resistance in various ways is a specific place in a region or market through which the price tends to go down. Another notable thing here is that in resistance the price reaches a point where the pressure exceeds the demand for which the price starts.
How we can identify both zones
We have to draw different lines here to identify both our regions and the prices are long lasting in different ways and extend here in many ways which have more quantity between different sellers and buyers. So according to the above analysis we can change the prices in different regions due to which we have to trade in different ways in different regions and we have to be reliable for a long time. When we have different prices between the lines they spread differently and for different support or resistance they don’t seem to have much of a side and they stay inside limited in different cases. Lastly, in order to identify both regions, we need to identify the different times of support or resistance between different buyers and sellers.
Question 4- Explain in your own words at least 2 simple chart patterns with screenshots
Now I will discuss the two chart details and directions.
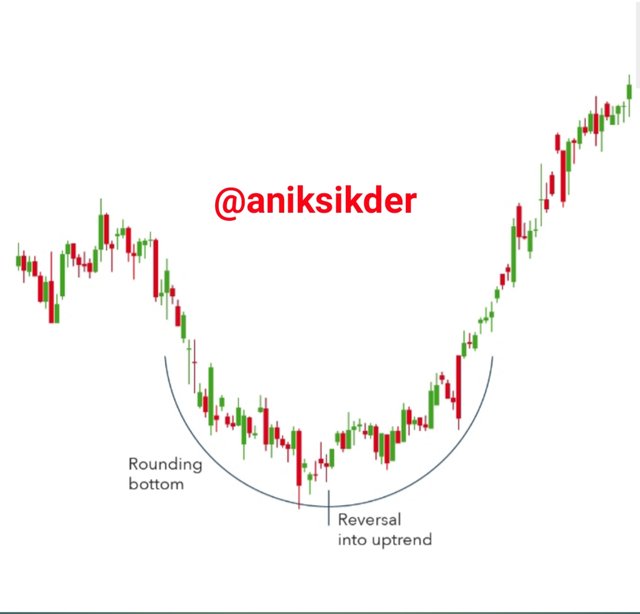
Rounding bottom
Rounding I mentioned below a chart where we can see that technically different types are identified for the series for analysis which graphically we can create in different shapes. It is often thought of as a trader or a different event that they will move in a way about the price and ensure a different kind of activity. When I give the chart to myself I can see it looks like a circle and here it looks like a different bottom cup and a different handle pattern and gives extra signals for heaven that he will take me down in different ways. If we think otherwise it is known as different feelings which can gradually change from bearish to bullish at any time.
Rounding bottom chart example.
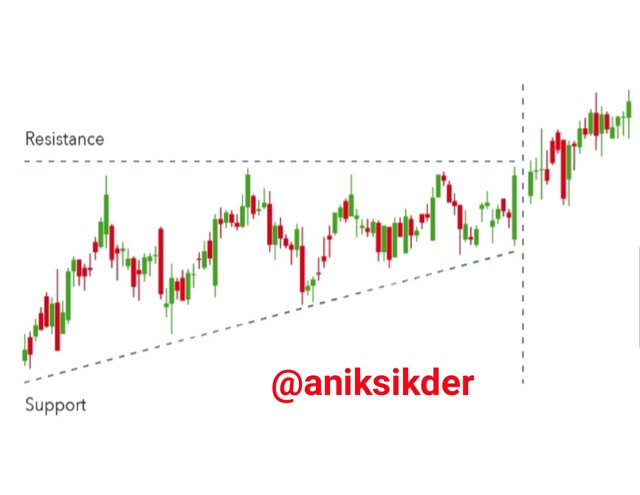
Ascending triangle
Ascending triangle is a chart pattern and it helps to draw the trend line down. If you look inside my chart, you can see that two lines and a triangle can be formed here. The various continuity indications of the ascending triangle are said to be that the price was usually just before the formation of the triangle which could breakout in different ways. The biggest thing is that the Ascending triangle business is different and the profit target for a cleanup is different. Lastly I would like to say that this pattern has different resistances for different properties with instruction in different places.
Ascending triangle chart example.
CONCLUSION
This is the end of my Homework post for session 3 and week 3. Thank you so much Professor @lenonmc21 for giving us this knowledge. I believe that all newcomers like me can achieve a lot by trying this post. This is a very important aspect for technology traders nowadays because they can easily see the prices with the help of different trends here and one of the reasons for support and resistance here is that traders can use it very easily. The most important way to understand this is that they can easily predict what will happen in the future through charts.
They will be able to gain knowledge in a very important way through patterns and use the tools that are digital. Here one has to learn how to manage the remedy chart well then traders can easily guess through the tools and trends. Lastly, I learned in class today that prices turn differently through support and resistance and traders can easily chart their prices to see where they are now and they can digitally chart their tools through this facility.

Regards:
@steemitblog
@aniksikder
Here My Twitter Link