[Technical Indicators 2] - Crypto Academy / S4W4- Homework Post for @reminiscence01
.jpeg)
Am gladdened once again for yet another opportunity of this wonderful edition by the cryptoacademy. From the lecture offered by Professor @reminiscence01, reading through this lecture series have given me a better insight on technical indicators. To this, I will be writing based on the task given by the Professor.
1. a) Explain Leading and Lagging indicators in detail. Also, give examples of each of them.
Leading Indicators
Leading indicators are technical indicators that investors or traders uses in determining or forecasting a possible movement of price of an asset in the cryptomarket before the movement starts. It aids or gives signals to traders on the next price movement (If it is going to be a bearish move or bullish), so they can enter their trade timely before its starts the actual movement. It is an indicator that leads a trader into a particular price trend movement. Examples of this type of indicators are: stochastic oscillator, vortex indicator, etc.
Lagging Indicators
Lagging indicators are technical indicators which signals traders or investors about the movement of an asset (If it is in a bearish trend or bullish trend) after the trend has already started. Examples of this type of indicators are: parabolic sat, moving average, etc.
b) With relevant screenshots from your chart, give a technical explanation of the market reaction on any of the examples given in question 1a. Do this for both leading and lagging indicators.

From the chart above, we see how the price movement of the asset reacted after the indicator signaled an overbought; thus the price movement was reversed to bearish trend likewise the chart below, we see how the indicator signaled an oversold and the price reversed to bullish trend. These are examples of a leading indicator


From the chart above, we see how the indicator showed the signal after the trend might have already started. This is an example of lagging indicator
2. a) What are the factors to consider when using an indicator?
First, as a trader, you need to study and know the asset market trend you are investing in, if it matches the type of indicator you are to use. Different indicators are for different functions. There are indicators which studies or signals volatility of assets, some signals price momentum of assets, etc. so knowing and understanding the trend of an assets as well as the type of indicator if it matches the asset trend will help you to actualize your trading strategy thus a successful trading achieved.
b) Explain confluence in cryptocurrency trading. Pick a cryptocurrency pair of your choice and analyze the crypto pair using a confluence of any technical indicator and other technical analysis tools. (Screenshot of your chart is required ).

Confluence in cryptocurrency trading deals with the use of different technical tools to determine the same signal on a particular asset. For instance, I use a technical indicator to signal price reversal of an asset; I also confirm the same price reversal of that asset when using another technical tool. This is what we mean by confluence in cryptocurrency trading.
3. a) Explain how you can filter false signals from an indicator.
False signals can be filtered from an indicator if the indicator spots a signal, but the market moves in the opposite direction to the signal spotted. For instance, in a bullish trending market of an asset, an indicator spots an overbought which signals a possible reversal in the trend to bearish trend. Instead of the market to move according to the spotted signal, it then continues in its bullish trend. This is how false signals can be filtered from an indicator.
b) Explain your understanding of divergences and how they can help in making a good trading decision.
Divergence in trading talks about the movement of assets in opposite direction to the technical indicators. It comes either as bearish divergence or bullish divergence. The bearish divergence occurs when the asset moves in an uptrend while the indicator shows a downtrend movement. The bullish divergence occurs when the asset moves in a downtrend while the indicator shows an uptrend move.
Divergence helps in making good trading decision because it filters false signals of an asset thereby giving a trader or investor an information on when to enter the trade without running at loss.
c) Using relevant screenshots and an indicator of your choice, explain bullish and bearish divergences on any cryptocurrency pair.
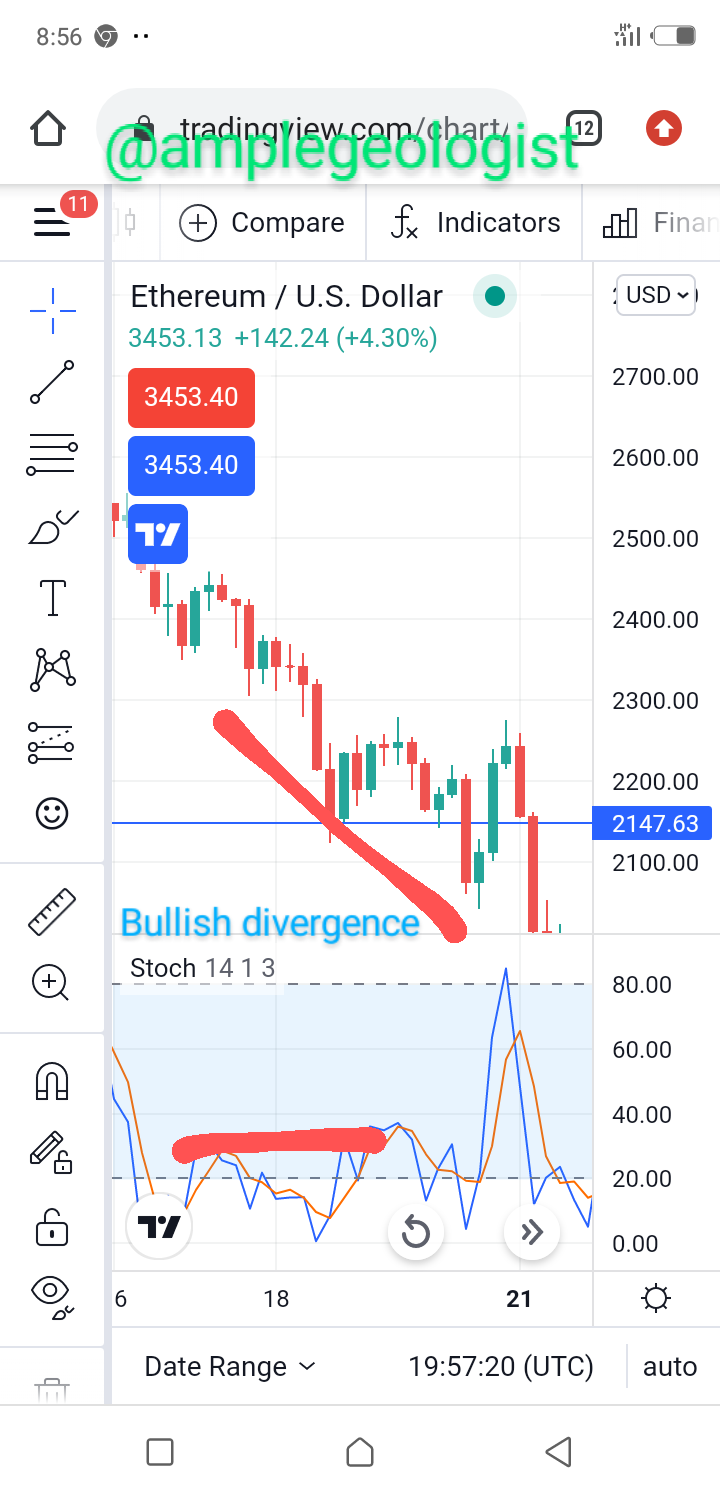
From the chart above, the market trends in the opposite direction to the bullish signal

From the chart above, the market trends in the opposite direction to the bearish signal.
Hello @amplegeologist, I’m glad you participated in the 4th week Season 4 of the Beginner’s class at the Steemit Crypto Academy. Your grades in this task are as follows:
Recommendation / Feedback:
Thank you for participating in this homework task.