Using CryptoViz: An Advanced Orderbook Visualization Tool for Cryptocurrency Trading
Recently, data-driven trading has been a very popular trend among traders. However, the wide range of information sources available can make trading cryptocurrencies feel like trying to fish a useful tidbit out of a deluge of data. There's the orderbook depth chart, the ticker feed, candlestick charts, hundreds of indicators, and dozens of interacting currency pairs to take into consideration at the same time.
To try to help solve this problem, I created CryptoViz, an interactive orderbook analysis tool that can make sifting through real-time market data a much more manageable task.
Here's an example of what the CryptoViz interface looks like:

At first, it may seem like a lot going on, but breaking it down is very simple. At its core, CryptoViz shows how buy and sell orders are placed, changed, and filled over time. It lets you see in real time when walls are created, when they're broken, and how the price reacts in response to that happening.
Let's break down the individual components that make up the interface.
Volume Bands
The volume bands are the core feature of the tool. To create them, the visualization is divided into slices and the total volume in resting buy/sell orders in those slices is totaled up. When stacked on top of each other, they provide a very detailed view into where liquidity lies and how much of it there is.
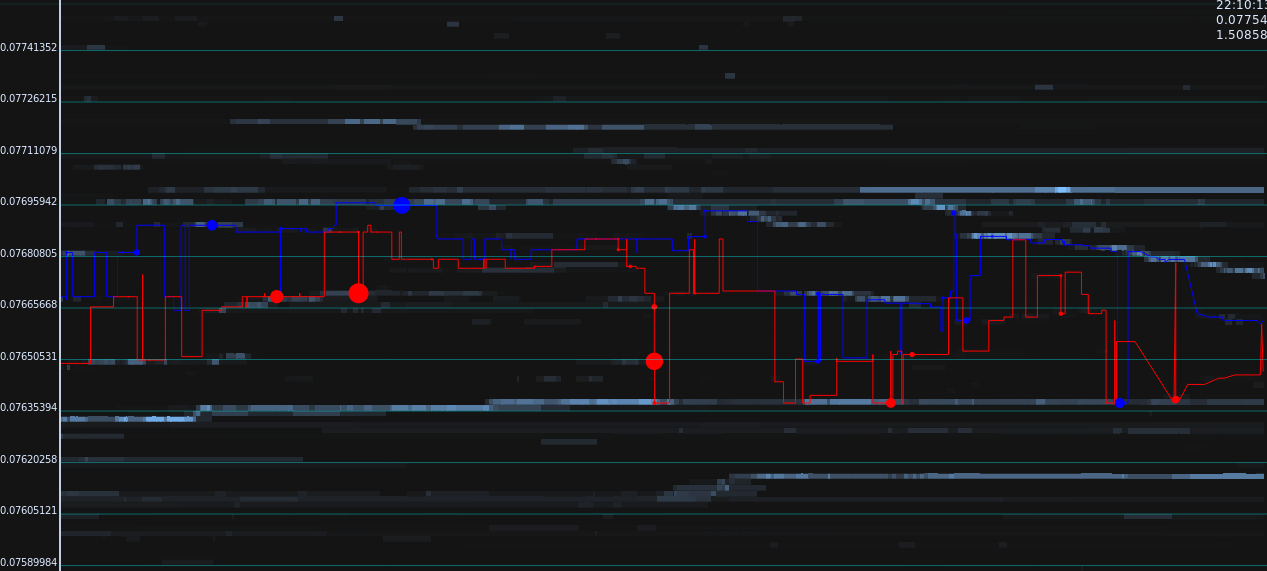
In the image above, you can see the range of trading within an area bounded on both the top and bottom by resting buy and sell orders. Buys are filled at the best sell offer, and sells at the best buy offer. Generally, large amounts of resting liquidity act as support or resistance until they're either removed or broken, allowing the price to move more freely to higher or lower levels.
This is a very important concept to grasp not only for using CryptoViz but for trading in general. The less volume there is in orders on either side of the current price, the more rapidly and dramatically the price will move. This is often called having "thin" books, and is often found after periods of high volatility where the price rises or falls significantly in a short period of time. While books are thin, even small orders have the potential of moving the market.
There are many ways to interpret the information from price bands that are tied into a variety of different trading styles and strategies. I'll go over a few of my favorites later in this writeup.
Trade Indicators
The red and blue lines and circles represent trades. The large circles represent large trades occurring and the lines connecting them trace a path through the buys (blue) and sells (red) that take place.
Hovering over a trade circle will show some information about the trade including how much currency was transacted and at what levels.

In the image above, a resting buy order for 10,000 ETH was filled all at once by an even larger sell order, driving the price lower and leaving a resting sell order in its place. CryptoViz allows you to easily see events like these in real time and react to them quickly. Rather than staring at a traditional depth chart that only shows the current market depth, you can see the market's history and how the depth has evolved over time.
Using This Data for Trading
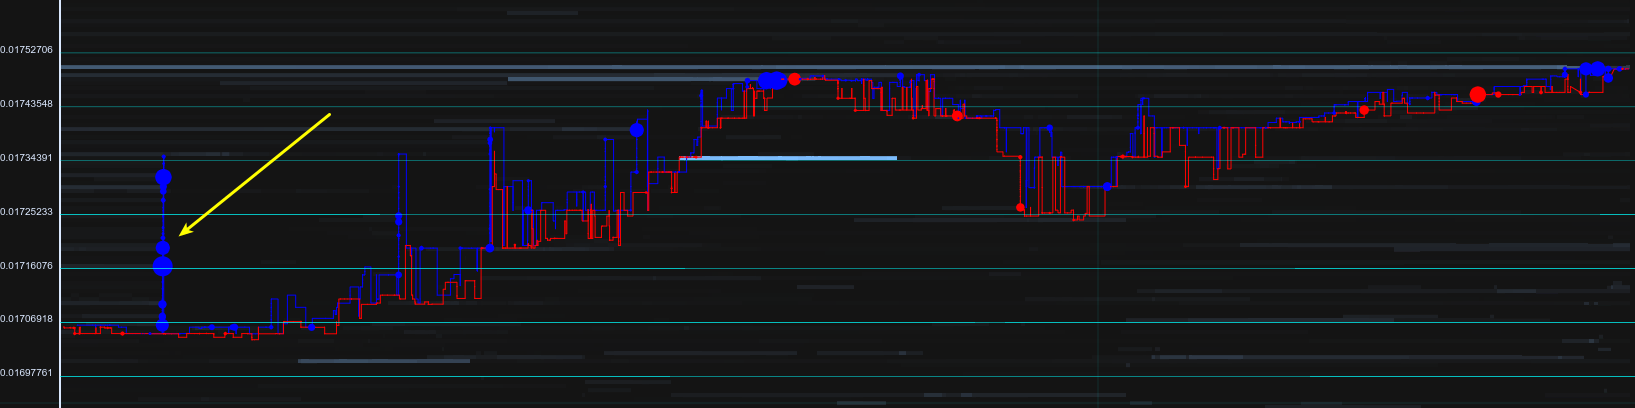
The above screenshot shows a great example of how the market responds to a large market buy order. The order was so large that it wiped a large portion of the available ask-order liquidity from the book in one go, eliminating all of the resistance holding the price down instantly. It's easy to see this liquidity vanish in a closer view:
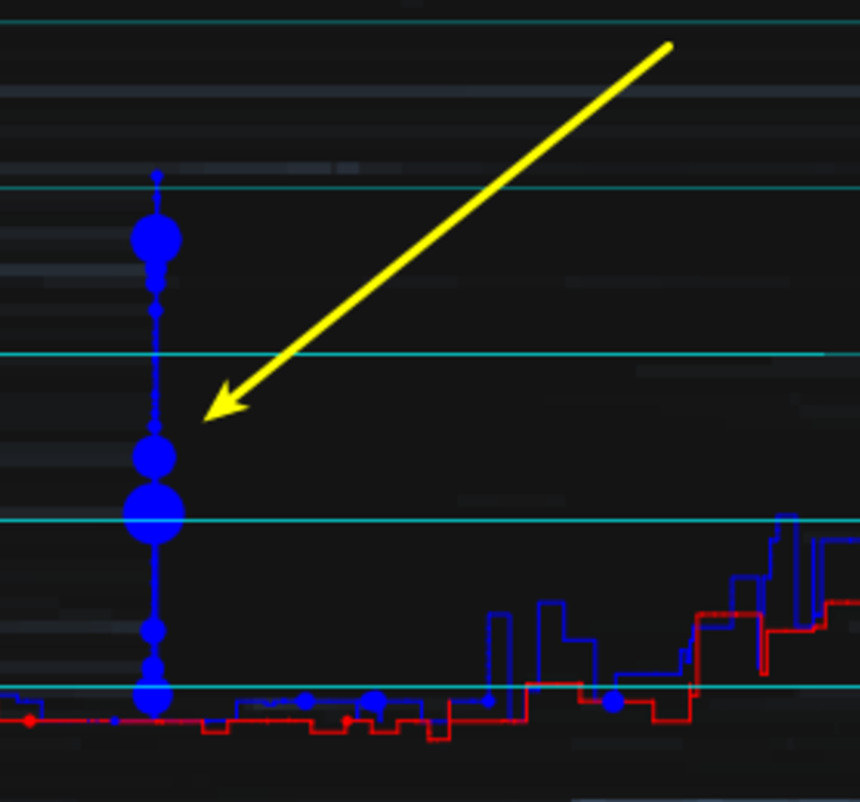
With the resistance gone and since very few new sell orders were opened up to fill in the void, the buy and sell pressure becomes unbalanced which drives the price up. A large buy wall at 0.01734 helped to provide additional buy-side pressure, pushing the price even higher.
This is the kind of activity that CryptoViz draws into sharp focus. Similar tools have been used in other financial markets for years, but I've not encountered anything else even remotely like this for cryptocurrency trading.
The entire CryptoViz tool is 100% free and open source on Github: https://github.com/ameobea/cryptoviz
I also have a twitter account on which I post the occasional useful or interesting screenshot: https://twitter.com/cryptoviznet
I'd love to hear what you guys think of this tool. I've got some plans for improving it and adding additional features in the future, and I'd love to work with anyone interested in using this tool for trading or contributing to its codebase!
I'd also love to answer any questions or feedback in the comments.
Thanks for checking out CryptoViz; I hope you can find it useful!