Polkadot (DOT) Analysis
Price Analysis: May 15, 2024
Current Price: $6.91 USD
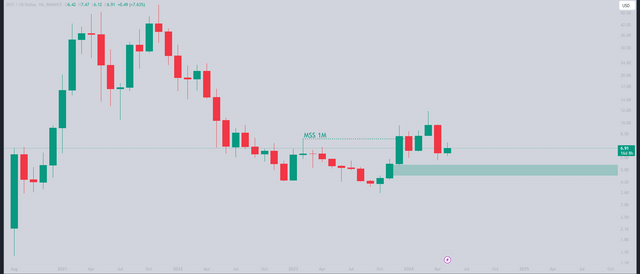
Market Structure Shift: The monthly timeframe suggests a potential bullish signal with a confirmed market structure shift at $7.88. This indicates a possibility of the price breaking upwards in the future.
Low Volume: However, it's important to note the relatively low trading volume this month. Lower volume can lead to less price volatility and potentially hinder a strong breakout.
Overall: The monthly chart presents a mixed picture. While a potential uptrend is signaled, the low volume creates some uncertainty.
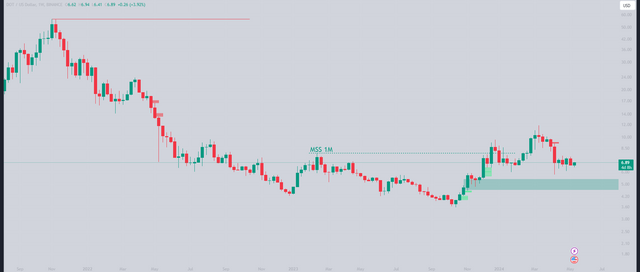
Rangebound: The weekly chart currently showcases a rangebound movement between $6.10 and $7.37. This consolidation phase could precede a potential breakout in either direction.
Liquidity Concerns: The lack of significant price movement might be attributed to lower liquidity, which can lead to a period of stagnation.
Overall: The weekly chart suggests a wait-and-see approach, as the price is currently stuck in a range.
Disclaimer: This analysis is for educational purposes only and should not be considered financial advice. Investment decisions based on this information are at your own risk and discretion.

