Navigating Reserve Rights Token (RSR) Amidst Market Volatility: A Comprehensive Analysis
In the dynamic realm of cryptocurrencies, Reserve Rights Token (RSR) emerges as a unique solution addressing prevalent challenges such as volatility, inflation, limited crypto adoption, and low merchant trust. This innovative dual-token system comprises RSR, a utility token that grants holders voting rights in governance proposals, and RSV, a stablecoin designed to maintain a consistent value of $1.
RSR's Role in Stabilizing RSV
RSR plays a crucial role in maintaining RSV's stability. When RSV's price exceeds $1, RSR is sold and converted into RSV, bringing the stablecoin back to its intended peg. Conversely, if RSV's price dips below $1, the protocol purchases RSV to restore its stability. This mechanism effectively dampens price fluctuations and ensures RSV's stability.
Technical Analysis: Unveiling Price Trends and Potential Movements
Monthly Chart: Consolidation and Potential Rebound

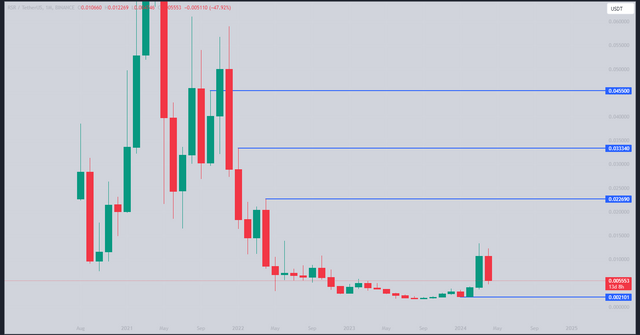
Examining the monthly chart, we observe that RSR currently resides in a consolidation phase, having formed a solid base throughout 2023. Following a significant upward move, the price has entered a corrective phase, presenting an opportunity for entry. A strong wick at the lower end of the consolidation zone indicates potential buying pressure.Weekly Chart: Filling the Gap and Overcoming Resistance

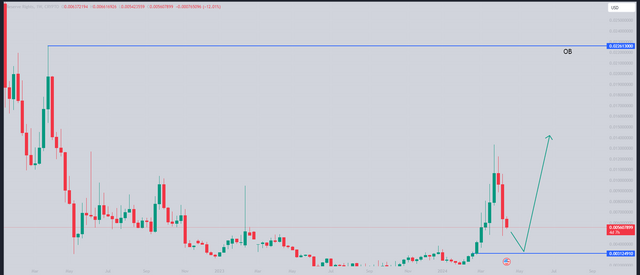
The weekly chart reveals a bearish SFP (Standard Fibonacci Pattern) formation, suggesting a potential downward movement. However, a notable fair value application (FVA) gap at the 0.00031 level highlights a potential price vacuum that could attract buying interest. Filling this gap could propel the price upwards, encountering resistance at the 0.0226 order block. A decisive break above this level could trigger a further upward surge, potentially reaching the 0.05 mark.Daily Chart: Sideways Movement and Potential Correction

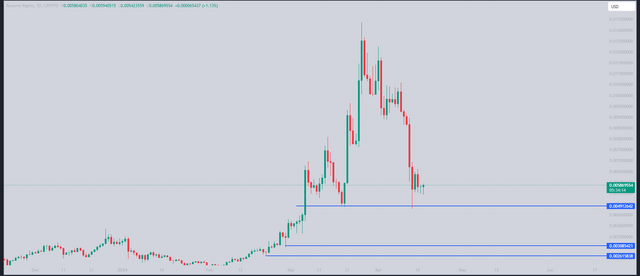
The daily chart presents a sideways movement pattern, with the price consolidating around the 0.0048 liquidity level. This consolidation phase could persist for some time before a potential correction downward. However, a subsequent upward movement is expected, driven by renewed buying pressure.4-hour Chart: Ranging Movement and Potential MSS

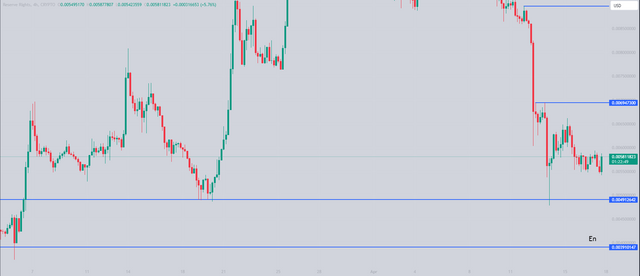
The 4-hour chart underscores the current ranging movement, with no clear indication of an MSB (Multiple Support Break) yet. The price may retest the 0.047 level, followed by a potential downward movement to sweep up liquidity at the 0.0039 level. This could set the stage for a strong MSB, potentially propelling the price upwards.
Disclaimer
It is crucial to emphasize that this analysis is solely intended for educational purposes and does not constitute financial advice. Any investment decisions based on this information are at your own discretion and risk.