HFT (Huft): Downtrend Lingers - Is a Reversal Incoming, or Further Decline?
Disclaimer: This is not financial advice. Please conduct your own research before making any trading decisions.
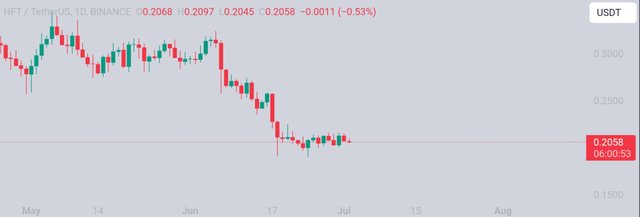
Huft (HFT) is stuck in a downtrend, currently priced at $0.2056 with a 24-hour volume of $3.57 million. While traders might be hoping for a price rebound soon, there aren't any strong reversal signals on the charts right now.
Market Context:
Looking at the HFT chart, there's no clear indication of a reversal in the immediate future. A wait-and-see approach might be wiser for now.
Downtrend or Rebound?
A decisive break above $0.25 with a strong bullish candle would be a significant sign that the downtrend is reversing. This would suggest a potential shift in momentum.
On the other hand, if the price can't overcome this resistance level and continues trading below it, the downtrend is likely to hold. There's even a possibility the price could test a support level around $0.19.
Trading Strategy (Wait and See Recommended):
Given the uncertain market conditions and the lack of clear reversal signals, it's recommended to wait and see before entering any trades.
Consider a long position only if the price breaks above $0.25 with a strong bullish candle, suggesting a possible trend reversal.
Keep a close eye on the price action around the current zone. If the price finds support and starts trading sideways, it could be an early sign of a reversal. However, a confirmed breakdown below $0.19 could indicate a steeper decline.
Entry and Target (if reversal confirmed):
Entry: If a trend reversal is confirmed, a potential entry zone could be around $0.20.
Profit Target: A potential exit point could be at $0.30, aiming to capture profits if the price breaks out and continues upwards.
Market Considerations:
Confirmation signals are essential before entering any trade. Wait for a clear break above $0.25 or a confirmed reversal from a potential support level.
The broader market sentiment can significantly impact HFT's price.
Past performance is not necessarily indicative of future results. The downtrend could continue, or the potential reversal might not materialize.
Additional Considerations:
Briefly discuss any technical indicators that support the resistance level at $0.25 or the potential support level at $0.19.
Emphasize the importance of confirmation signals, strict risk management with stop-loss orders, and the potential risks involved in trading during volatile market conditions.
Remind readers that this analysis is for informational purposes only, and they should conduct their own research before making any trading decisions.