Fetch.ai (FET) Price Analysis: May 20, 2024
**Current Price: $2.2035 USD (24-hour volume: $132 million)
**
Daily Chart:
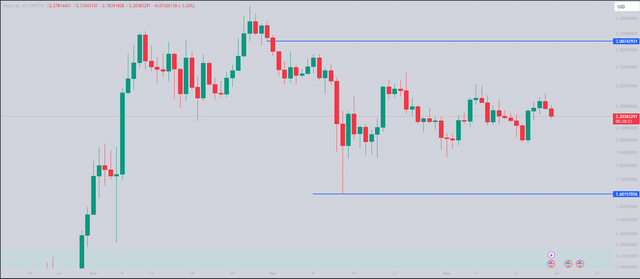
Rangebound Movement: The daily chart indicates a consolidation phase with a range between $2.64 (high) and $1.86 (low). This could be a sign of indecision in the market, with neither buyers nor sellers able to establish dominance.
Weekly Chart:
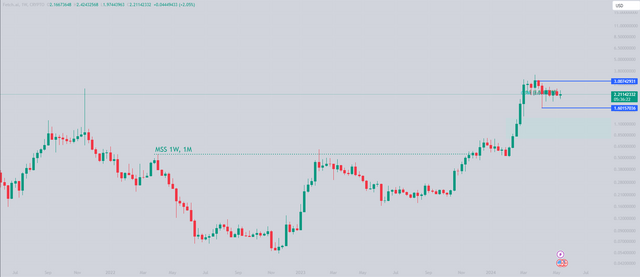
Swing Failure Pattern (SFP): You're right to identify the SFP on the weekly chart. This pattern suggests a loss of upside momentum after a failed attempt to break higher. The subsequent ranging behavior reinforces this observation.
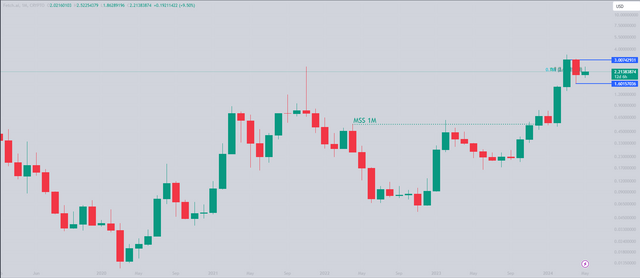
Monthly Chart:
Market Structure Shift: The monthly timeframe offers a more optimistic view. The confirmed market structure shift at $0.60 and the current price level near $2.52 (previous sell-side liquidity zone) hint at a potential long-term uptrend.
Overall:
The Fetch.ai (FET) price analysis presents conflicting signals across different timeframes.
Short-term (Daily): Consolidation or possible manipulation within a range.
Mid-term (Weekly): SFP suggests short-term uncertainty.
Long-term (Monthly): Confirmed market structure shift indicates a potential bullish trend.
Key Levels to Watch:
Upside Breakout: A decisive break above the daily resistance level of $2.64 could signal a continuation of the uptrend.
Downside Support: If the price falls, pay attention to the $1.86 support level (daily chart) to gauge potential buying opportunities or a possible trend reversal.
Disclaimer: This analysis is for educational purposes only and should not be considered financial advice. Investment decisions based on this information are at your own risk and discretion.