Biconomy: A Gasless Bridge Between Blockchains and Its Price Potential
Biconomy positions itself as a developer-centric cross-chain relay protocol, offering a gasless and user-friendly experience. It fosters secure connections between Layer 1 and Layer 2 protocols, simplifying DeFi network usage and development. The protocol is powered by its native work and governance token, BICO.
Technical Analysis: Unraveling BICO's Price Trends
Monthly Chart: Potential Bullish Breakout
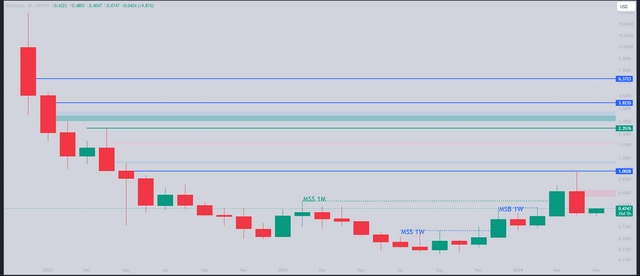
The monthly price chart for BICO suggests a possible market structure shift from the $0.55 level. The formation of a Monthly Swing Buy (MSB) pattern indicates a potential bullish trend. If confirmed, the price could climb towards $2.35.
Weekly Chart: Downtrend and Potential Reversal
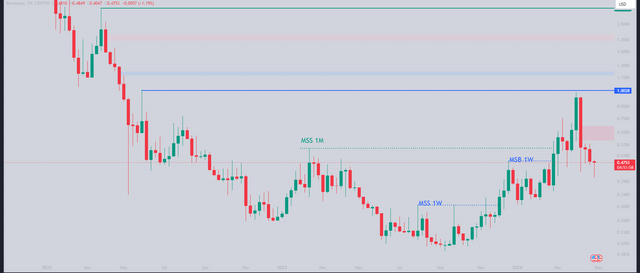
Despite the monthly bullish signal, the weekly chart reveals a downtrend for BICO. However, the price has potentially established a weekly MSB at $0.48. This formation, if confirmed, could indicate a reversal and the creation of another MSB on the weekly timeframe.
Daily Chart: Accumulation Zone and Imbalance
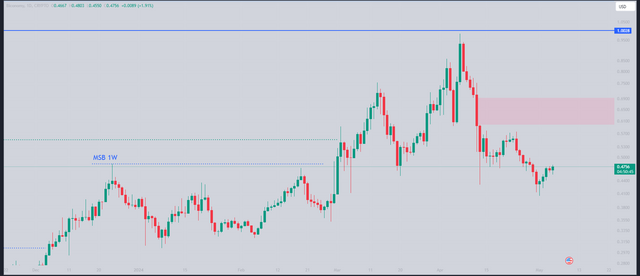
Currently, the daily chart depicts BICO within an accumulation zone, ranging between $0.577 (high) and $0.426 (low). An imbalance exists between $0.612 and $0.69, suggesting the price might attempt to fill this gap in the future.
Disclaimer
It's important to understand that this analysis serves educational purposes only and does not constitute financial advice. Investment decisions based on this information are at your own risk and discretion.