Analyzing ICON (ICX): Chart Patterns and Entry Points
ICON (ICX) primarily serves as the native currency of the ICON blockchain. ICON Crossing provides a blockchain framework to simplify development. It was launched in 2018 and has successfully navigated two bear markets.
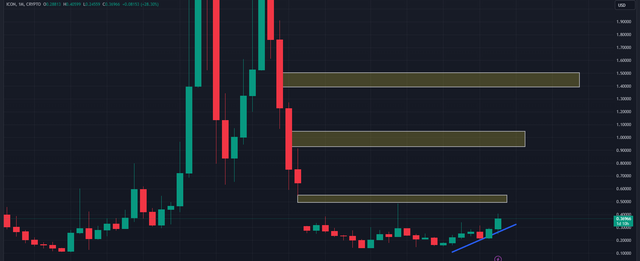
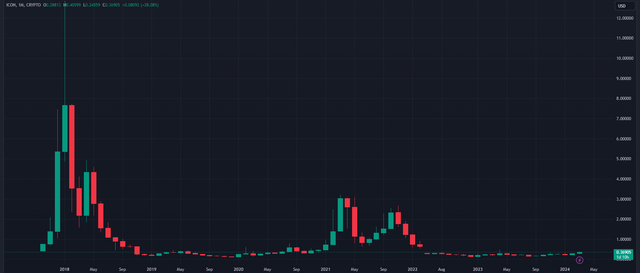
Observing ICX's chart on a monthly basis, it appears to be in a bullish trend. Looking at the weekly chart, trading is currently occurring around $0.3687, with no significant liquidity downside but creating sell-side liquidity at $0.47. However, there's a substantial gap between $0.48 and $0.64, which I anticipate will be filled in the near future.
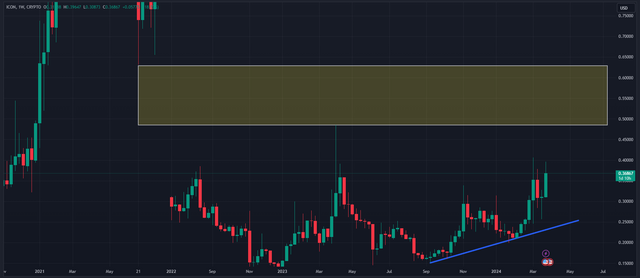
Examining the daily chart, there's an order block between $0.34 and $0.36, primarily concentrated at $0.34. Hence, I expect it not to drop below $0.34. The next target is $0.47, and if it breaks through, we may see it move directly towards $0.65.
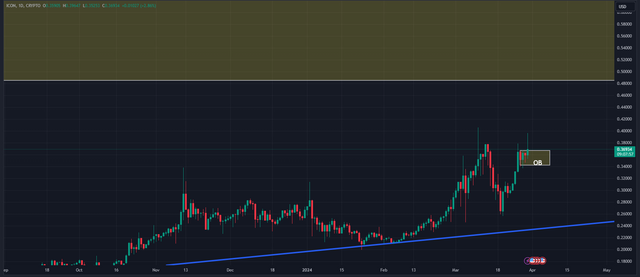
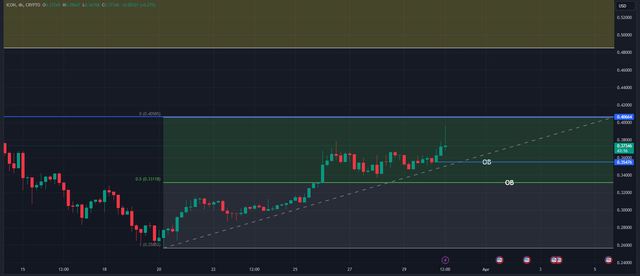
Now, for the ideal entry point, considering the four-hour chart, there are two order blocks: one at $0.35 and the other at $0.33. Given the presence of these order blocks, I anticipate it won't drop below $0.35. If it moves from $0.35 to $0.47, breaking the sell-side liquidity, we could witness a move towards $0.65.