OnChain Metrics part-2 - SteemitCryptoAcademy S4W3- Homework post [sapwood]
This is my submission for the Assignment provided by Professor @sapwood. This session was the extension of the previous session Onchain Metrics and I have participated in the last Assignment Homework as well.
(1) What is the difference between Realized Cap & Market Cap, How do you calculate Realized Cap in UTXO accounting structures? Explain with examples?
Market Cap:-
In the finance sector, the Market cap is referred to the value of any particular asset or Company. it is calculating by Multiplying the Total Number of Coins/Shares with the Current Price of the Asset/Equity. This is the simplest way to find the Market and valuation of any asset.
.png)
MarketCap (MC)= Total Supply* Current price of 1 Share/Coin
So suppose if the Max supply of any asset is 100 and the current price of 1 coin is $5 then the total market cap of the asset would be $500.
Realized Market Cap:-
Realized Market Cap is similar to Market Cap or I would say this is even better than MC as it tells us the actual value of the Asset. This is being calculated by multiplying Total Supply with the Last price of the asset when it was moved. When BTC was in the initial stage we all know it's worth way less than a dollar from that time there are a number of Bitcoins which has been lost or even locked in the wallet and not moved anywhere. These coins can be called dead coins because their no owner of them so if we calculate that BTC as per the current price then we won't get the actual Valuation of BTC.
I feel really sorry for Stefan Thomas who lost his BTC wallet password which now worth is more than INR 1,800 CR. lol... btw even I have also lost my blockchain wallet key and now it would be worth $100 XLM.
Realized Market Cap(RMC) = The sum of each UTXO * last movement price
Example:-
Let's suppose there is an Asset named A which is having a Max supply of 100 however 30 coins are locked from the time of its creation to the team. Rest coins are spent as per the below sheet-
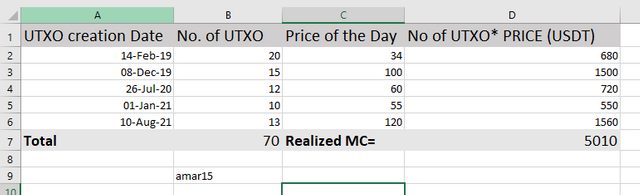
Difference between Market Cap and Realized Marketcap
- Market is very simple to calculate where the calculation of Realized market cap is a bit complex.
- Market Cap tells the max value worth of an asset where Realized market cap tells the actual worth of the asset.
- Market Cap has no relation with Participation/trading however Realized Market Cap does have a relation with participation in the market because on each transaction a new value will be generated.

(2) Consider the on-chain metrics-- Realized Cap, Market Cap, MVRV Ratio, etc, from any reliable source(Santiment, Glassnode, etc), and create a fundamental analysis model for any UTXO based crypto, e.g. BTC, LTC [create a model for both short-term(up to 3 months) & long-term(more than a year) & compare] and determine the price trend/predict the market (or correlate the data with the price trend)w.r.t. the on-chain metrics? Examples/Analysis/Screenshot?
Well, I wanted to use Glassnode to do my analysis however they are asking for a premium account trial. lol.. I will be using Santiment for this analysis.
Realized Marketcap:
Realized Market Cap is calculated when the asset was last moved/spent as per the above-given formula. The Realized Cap of any asset will increase when the participation of the public will increases and such a thing can be easily seen in the case of the bull market. So many new users come in the market also the Holder will move their asset on the exchanges for the profit bookings.Short Term (3 Months)-
.png)
In the beginning of the Bull run on the 25th of March, the Realized Cap of ETh was 71.5 B only after that it gradually started increasing with respect to the price and reached 112.95 B when ETH made a new all-time high. You can see after that the price started going down still the Realized Market cap is not going down this happened because of the Ever growing ecosystem of ETH Dapps that brings a lot of transactions on the daily basis. The growth of RMC is still increasing on the ETH due to its adoption.
Long Term (3 Years )-
.png)
We can see the growth of the Ethereum blockchain is exponential and due to the great demand of the Ethereum Blockchain. Initially, people were not that much interested in the blockchain but in the year 2018 the interest in the blockchain and developers started developing Dapps on the ETH Blockchain. In the longer run till now the Realized Cap of ETH is still increasing gradually along with the price or without the price as well.
Market Cap:
Marketcap is the total worth of any network and it is directly proportional to the price of the asset if the price of the asset will increases then the market cap will also increase. It has a direct correlation with the adoption of the network too and its price.
Short Term (3 months)-
.png)
You can clearly see how beautifully the market cap is moving with the Price. In the last 3 months, the Market cap made a low of $201,562,577, 009.00 at that time the price of eth was around 1800 USDT and it made a high of $466,245,815,413.00 at that time ETH made an All-time high of around 4300 USDT. You can see once the market starts correcting the market cap also started decreasing.
Long Term (3 Years )-
.png)
In the long term picture, you can see in last 3 years ETH made low of 82 USDT at that time the market cap was $9,400,044,026 and fro there it started increasing and made high of 4300 usdt in April 2021 and market cap reached its peak $466,245,815,413.00
MVRV Ratio= (MarketCap/RealizedCap):
MVRV is the ratio between MarketCap and Realized and it helps us to identify the potential Tops and bottoms in the market. Here is the cheatsheet to read the MVRV ratio-
a) If the MVRV ratio is more than 1 or above 100% and also creating High Highs then it signifies Uptrend.
b) If the MVRV ratio is exactly 1 then it would be considered indecision or breakeven.
c) If it is below 1 or 100% and also creating Lower High then it signifies Downtrend.
d) If it is above 2 or 200% then it will be considered a strong uptrend or greed in the market.
Short Term (3 months)-
.png)
In the last 3 months on 4th July the MVRV ratio was 126% after that it started creating LH LL and the price reached to $1700 as a bottom at that time the MVRV ratio was 73%. it reveres after making this low and made high of 200%. In this case, you can see how we identified the Bottom using MVRV ratio and top.
Long Term (3 Years )-
.png)
As you can see in the chart on the 7th Oct 2020 it made low of $82 and at that time MVRV ratio was lowest 41% after that it started increasing in 2020-2021 Bull cycle the price reached a new All-time High and MVRV reached its peak 300%. After creating this high it started going down and we have seen a good correction.
(3) Is the MVRV ratio useful in predict a trend and take a position? How reliable are the upper threshold and lower threshold of the MVRV ratio and what does it signify? Under what condition the Realized cap will produce a steep downtrend? Explain with Examples/Screenshot?
MVRV Ratio in Trend prediction:
MVRV Ratio works really well in the long term in the above chart you can see that it made a low of 40% which is the lowest till now once it reaches near 50% then we can expect the bottom area and can start accumulating the asset. Once you see it breaks the downtrend of creating LH, LL, and starts making new HH, HL then you can take a new position.
Also, the MVRV ratio can help us to get exit on the right time as a professor has discussed if MVRV ratio is 200% other it is considered as 2x profit zone and if it is 300% then it will be considered as 3x profit in the market so this is the area where we can start selling our bags.
It can be used as a confirmation tool for the Investors however this is not alone we can combine it with other Onchain metrics tools and technical analyses to get the Perfect Entry.
Reliability of the upper threshold and lower threshold of the MVRV ratio:
0.png)
In MVRV upper and Lower threshold what we do is to mark the level like Lower limit less than 1 that is considered as demand zone or undervalued and upper limit 3 which can be considered as Supply zone or Overvalued zone. When the MVRV is less than 1 then it is an opportunity to fill our bags and accumulate as much as we can and once it reaches more than 3 then we can start selling our bags and book our decent profits. The reliability of the Upper and Lower thresholds is good and has 80% accuracy as per my observation.
Under what condition the Realized cap will produce a steep downtrend?
This scenario happens when people reduce their participation in the market as you can see in the chart in the bull run the Realized cap is increasing however once it reaches to the All-time high of 64k it dumped hard from there. Bit players started selling their bags and small investors/retailers got trapped there..png)
Well, I am also one of them who got trapped bought at the top and become a holder of the time. Due to our emotions, we really don't want to book losses rather than we would prefer to hold the particular asset. In the bear market, the participation will decrease and people lose interest as result the Realized Market Cap will steep down.

Conclusion
On-chain metrics is really an amazing tool that will help us to know the insight of the asset and what's going on in the market and sentiments. MVRV and Realized market are will be very helpful for the long-term investors and they work really well on a larger time frame. The session conducted by the professor was really awesome and I enjoyed doing this assignment.