Assignment Crypto Academy Season 04 - Week 02 | Advanced Course -Crypto Trading With Volume Indicator[@kouba01]
This is my submission for the Assignment provided by Professor @kouba01. The session was on Volume indicator and the professor explained the in-depth use of Volume to make our trading more accurate.
1. Explain the volume indicator in your own words.
In the world of trading, Volume is nothing but the amount of Buy or sell order that has been exchanged between the Buyer and Seller in a given period of time like 5 min, 15 min, 1 hr, 1 day, 1 week, or even 1 year. This is plotted at the bottom of the Asset chart in the Verticle Bars and these bars are in two colors Red and Green. The Green bars represent that the Buyers have control and the Red bar presents the seller took the control to take the price down as you can see in the below chart. One bar represents the amount of buy/sell of the asset in a given period of time.
Volume is the most essential part of Trading as almost all the indicators are made of Price, Volume, and Momentum. Volume can help us to identify the trend reversal and the strength of any ongoing trend. I will be discussing this thing in detail in the next question.

2. Use a platform other than Tradingview to present the volume indicator on a chart and show how to configure its parameters by justifying your choices. (Screenshot required)
I am going to use Binance to represent the Volume on the chart. Usuallly you will automatically get some moving averages and Volume on the chart but if you won't get then you can follow these steps.
Step-1: Go to https://www.binance.com/en/trade/BTC_USDT
Step-2: Click on Indicator.
.png)
Step-3: Click on Vol. You need to check the Vol button and also if you want to implement Moving average on the chart you can do this just by filling the time period of moving average in the box.
.png)
As we know that we can implement moving averages as well on the chart. It will be plotted on the basis of the previous volume like if we will take 20 periods then it will be plotted on the basis of 20 Vol bar average. I am going to use 50 moving average.
.png)
You can modify the settings of the Vol bar by just clicking on Setting Icon to configure it as per your own need.
.png)
3. What is the link between Volume and Trend and How to use volume to predict a trend reversal? (Screenshot required)
Volume plays a very important role in the movement of the Price. if the price of the asset is moving up then the Volume of the green bar should be more and move upside. And if the price is going down the Vol of Red bar should be growing.
The more volume in the favour of the trend shows the strength of the Trend.
.png)
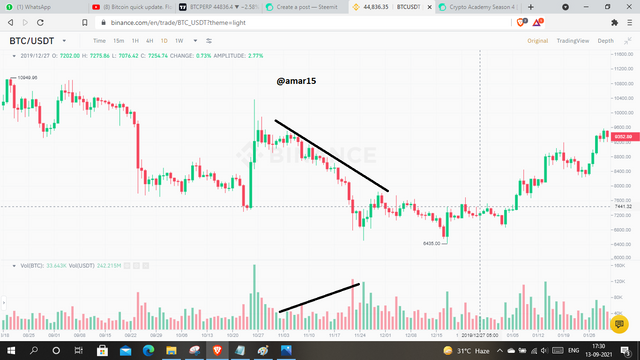
Here you can clearly see that the price is moving down and the Vol of the red bar is increasing too which shows that the seller is much stronger than Buyers.
.png)
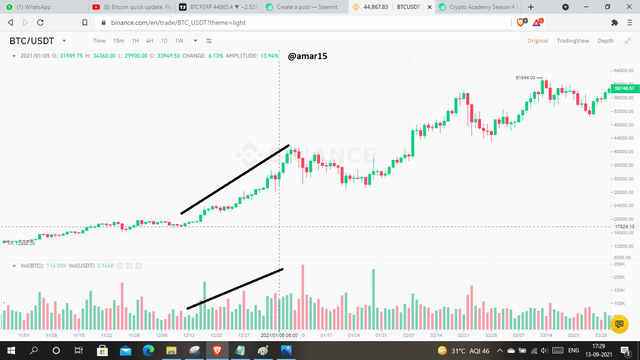
Now let me show you the importance of Volume in the trend reversal. In this chart, you can see the price is upside however, the Volume is flat and not moving upside it shows weakness in the trend. after some time it crashed.
.png)
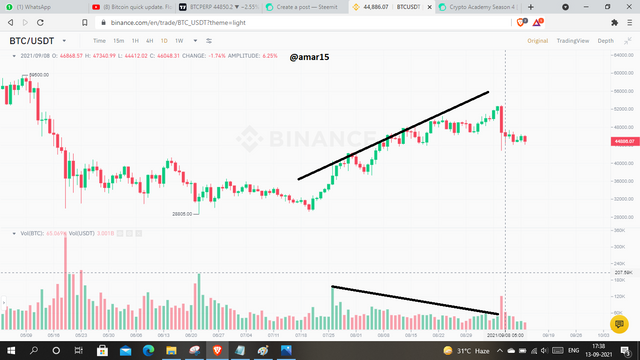
Let me show you a recent example. There is a 10k USD crash in the BTC on 7th Sept 2021. Well, the volume is not the only factor behind this dump however we can notice one important thing. As you can see in the chart the Price is continuously going up however the Volume is either flat or going down. In such a scenario, we need to be alert that it may show reversal anytime and exactly this happened. We can clearly see the Bearish Diversion here and the price dumped.
.png)
4. How to use the volume to have a signal confirmation? (Screenshot required)
I used to check the Vol to indefinite the strength of any breakout or breakdown. if the volume is less at the time of breakout then it can be a fakeout as the price is breaking any kind of pattern or zone then technically the participation between the Buyer and seller should be good.
As you can see in this picture the BTC was moving in a downtrend channel once it is given the breakout you can notice the Volume. The volume is higher than the average Volume that shows the strength of the Breakout and participation.
.png)
Here is another example where BCH breaks down important support and you can see volume is much higher than the average Vol. It dumped hard after the breakdown.
.png)
5. How does the volume reflect the evolution of prices in the charts and why does the volume sometimes anticipate the price? (Screenshot required)
The price of the asset is the reflection of Volume generated towards either the buy-side or the Sell-side. If the Vol is more towards the selling side then the price will down vice versa.
** As we understand that the volume is the exchange of Buy and Sell orders between the buyers and sellers. If the price of the asset is increasing then this is not necessary that the volume should also increase there could be other factors as well that drives the price of the asset. We may see that the Volume is not cooperating with the price especially in the slow momentum. Even if the price is increasing and the volume is stable so there could be the reason the Participation si less however the Buyers are more as compare to the Sellers same vice versa.
Scenario-1: Here you can see the price of SOL is decreasing and the vol is decreasing too.
Scenario-2: In this, you can see the price of Sol is going down slowly however the volume is stable.
.png)
Here is another chart that shows the Anticipation of Volume with the Price.
6. Is it better to use the volume indicator alone or use it in parallel with another indicator when trading? Justify your answer
Volume can be very helpful for the pure Price action trader who likes to trade on Breakouts and with the help of Volume then can know the strength of the breakout. I am a price action trader and use Volume as confirmation most of the time however if we combine Volume indicators with another indicator then it will definitely give you an edge.
To Justify my answer I am going to use an Indicator named SSL Hybrid that tells us to buy/sell signals. here in the chart, you can see how we can get confirmation.
- When the Indicator tells us to buy we can see the Volume it should be at least higher than the previous 3 candles.
- When you can see it is giving the Buy signal again but the Vol is not much as compare to its previous candles. It turned into a sideways movement.
- When the indicator generated Sell signals you can clearly see that the Volume is much higher than the previous 5 candles. it can be considered a strong signal.
.png)
7. The volume indicators are multiple, choose one of them to briefly explain its usefulness in crypto trading.
There are so many Volume indicators in the market currently, I don't use any of them personally however one of my friends shared one beautiful Volume indicator named Price/Volume Value Histogram. This indicator looks good on the chart and gives us a Pictorial representation of Volume. It helps us to know the Buying or selling pressure using volume. It looks similar to MACD however it has no line other than shadows.
Let me share how we can get this indicator on the chart.
Step:1-Go to Tradingview.com and open any chart.
Step:2- Click on Indicator section
.png)
Step:3- Type "Price/Volume Value Histogram" in the search box. Once you get the indicator just click on it and it will be implemented on your chart.
.png)
.png)
Observation:
Green Shadow- It shows the buying pressure if the green shadow keeps increasing that means the buyers are strong and taking the price up, where if it starts decreasing then the buyers are losing control, as a result, the price may go down.
Red Shadow- It shows the selling pressure if the red shadow keeps increasing that means the sellers are getting stronger and taking the price down where if it starts decreasing then the sellers are losing control, as a result, the price may go down.

Conclusion
The session was really full of knowledge and I really enjoyed doing this assignment. Volume is really important in trading and if we combine it with Indicators and Price action then it will help us to get better accuracy in Trading. It helps us to avoid false breakouts and trend reversals that definitely will give an edge in Trading
Hello @amar15,
Thank you for participating in the 2nd Week Crypto Course in its 4th season and for your efforts to complete the suggested tasks, you deserve a Total|6/10 rating, according to the following scale:
My review :
Work with acceptable content. It was possible to go deeper into the ideas presented and provide several examples. Here are some notes that I bring to you.
Your explanation of the volume indicator was brief and did not highlight its most important characteristics.
As for the second question, you did not justify your choice of setting 50.
You did not provide a good explanation of the indicator's relationship to the trend and its repercussions, and the same for confirming the signals.
The rest of the questions and I was somewhat satisfied with your answer.
Thanks again for your effort, and we look forward to reading your next work.
Sincerely,@kouba01
Thank you for the feedback professor.