ETH/USD Weekly Forecast: What’s Next for Ether?
Ether is still in the bullish zone against the US Dollar, but struggling versus bitcoin. ETH/USD is following a bullish pattern on the daily chart with support near $280.00.
Key Highlights :-
Ether is following a bullish pattern against the US Dollar, but struggling to gain momentum above $300.00.
There is a key contracting bullish triangle forming with resistance at $315.00 on the daily chart of ETH/USD.
ETH/BTC broke the 0.070BTC support zone and remains at risk of more losses.
Technically, the daily chart indicators are moving higher in the bullish territory.
Ether Price Upside Barrier
There were a few swing moves in ETH/USD this past week as it closed the week above $280.00. Conversely, ETH/BTC seems to be struggling a lot and remains at risk or more losses below 0.070BTC.
.png)
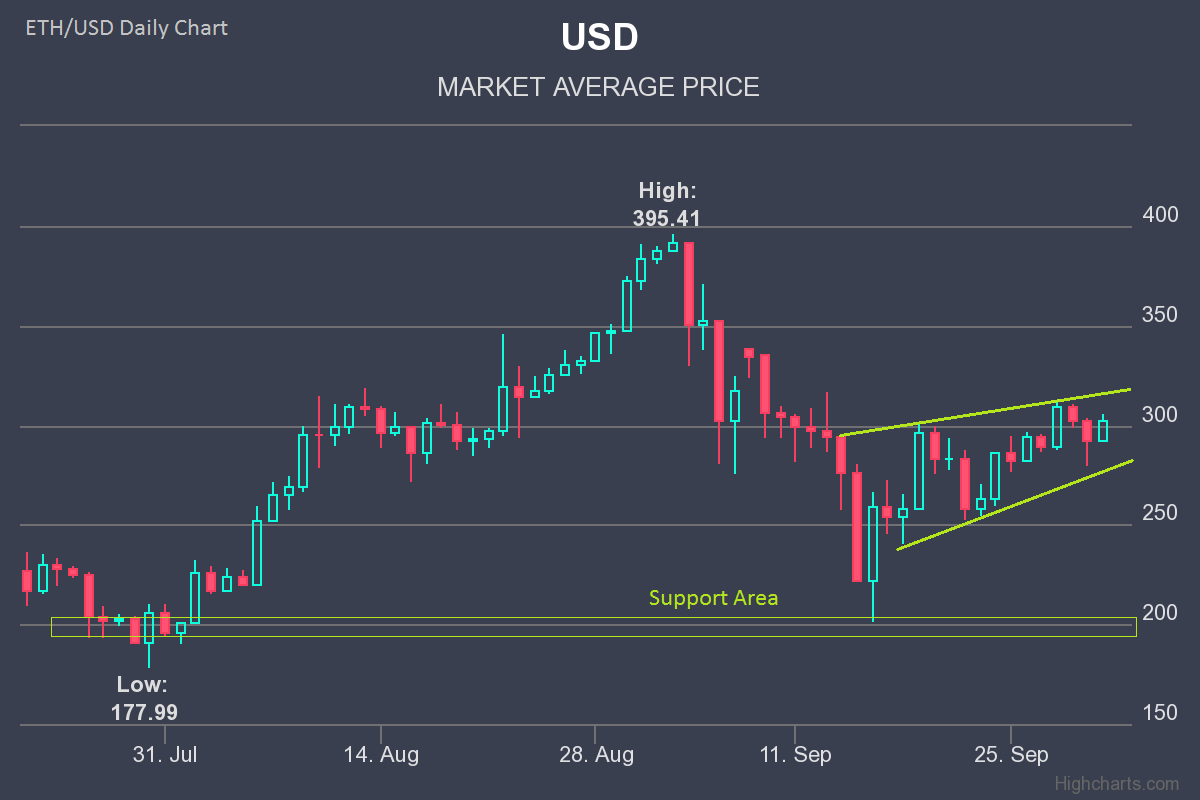
Starting with the daily chart of ETH/USD, the pair is forming a key contracting bullish triangle with resistance at $315.00. The triangle support is near $280.00 and holds a lot of importance for the current bullish trend.
Ether buyers need to gain momentum and break the $310.00 resistance in order to test the $340.00-350.00 resistance area. Before $310.00, a daily close above $300.00 is required since it is the 50 percent Fibonacci retracement level of the last major decline from the $395.41 high to $200.91 low.
Should there be a daily close above $300.00, the price would easily surpass the $310.00 level to test the next hurdle near the 61.8 percent Fibonacci retracement level of the last major decline from the $395.41 high to $200.91 low.
.png)
On the flip side, a daily close below $280.00 would negate the current bullish bias. In the mentioned case, the price could resume its slide and test the $240.00 support.
Moving down to the 2-hour chart of ETH/USD, there is a bearish trendline forming with resistance at $304.00. The pair recently broke a connecting bullish trendline with support at $300.00, but lacks downward momentum.
To sum up, a daily close above $300.00 would be significant for Ether to make further gains. On the other hand, a close below $280.00 could ignite losses.
Weekly Resistance Levels
$300.00 and $310.00
Weekly Support Levels
$280.00 and $240.00
Daily RSI
The RSI is just above the 50 level.
Daily MACD
The MACD is in the bullish zone, but lacks momentum.
Disclaimer:
The content on ETHNews.com is provided for informational purposes only and it is not intended to be, and does not, constitute financial advice or any other advice. You should not rely on any ETHNews.com content to make an investment decision. ETHNews.com is not responsible for any investment decision made by you. You are responsible for your own investment research and investment decisions.