On-chain Metrics(Part-3)- Steemit Crypto Academy- S4W5- Homework Post for @sapwood
.png)
Image edited by me in Powerpoint
1. How do you calculate Relative Unrealized Profit/Loss & SOPR? Examples? How are they different from MVRV Ratio?
Relative Unrealized Profit/Loss
| UTXO | Close Price | Quantity of Units |
|---|---|---|
| 5 years ago | 611 USD | 20 |
| 1 year ago | 10800 USD | 30 |
| 6 Months ago | 59100 USD | 25 |
| 1 Months ago | 51700 USD | 20 |
| 1 week ago | 44000 USD | 5 |
While the Market Cap is: 100x50000 USD= 5000000 USD.
Realized cap is: (20x611)+(30x10800)+(25x59100)+(20x51700)+(5x44000)=3067720 USD.
Therefore, according to the RUPL formula, the result would be as follows:RUPL= (Market Cap−Realized Cap)/Market Cap
RUPL= (5000000-3067720)/5000000
RUPL= 0.38
For this example the RUPL gives a value of 0.38 or (38%) which places it in the Optimism- Denial zone, depending on whether the price is in an uptrend (Optimism) or downtrend (denial).SOPR
SOPR= Selling price (USD) all output spent/ Buying price (USD) all output spent.
To make an example let's go to Blockchain Explorer and take some real Bitcoin block data: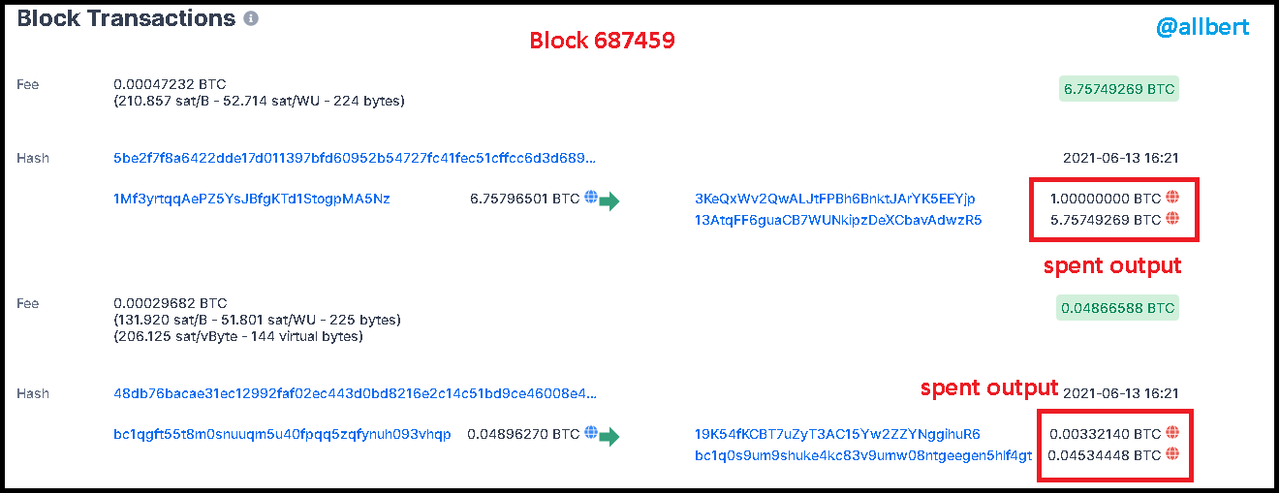
Image taken from: Source
Price Sold= (6.757+0.048)* 50000=340250 USD
Price Paid= (6.757+0.048)*39017.37= 265513.203 USD
SOPR=340250/265513.203 = 1.28
Obviously, this result greater than 1 corresponds to the fact that the coins were sold at a much higher price than the purchase price, therefore it is a sign that the holders are making a profit. This value of SORP = 1.28 indicates a local top within an uptrend.DIFFERENCES
In the case of MVRV the differences are obvious. So we will start from their formula, which is:
MVRV= Market Cap/Realized Cap
As we can see MVRV has similarities with RUPL in that both use the same data for its construction (Market cap and realized cap), however, while MVRV is only the ratio of market cap divided by the realized cap, RUPL is the ratio of the difference between market cap minus realized cap and then divided by market cap.RUPL= (Market Cap−Realized Cap)/Market Cap
Put another way, MVRV indicates whether the current price is below or above the fair value of an asset, while RUPL by the difference of subtracting the realized cap from the market cap we calculate the unrealized (floating) gain or loss, it just provides a hypothetical framework of what would happen if all the holdover coins were sold. This is why this indicator shows a broader view of cycles, as it takes into account the holdover currencies.
The RUPL also indicates what the market sentiment is. On the other hand, the SORP presents another type of data different from the MVRV, Selling price (USD) all the output spent and Buying price (USD) all the output spent. Through the division between these two factors, we obtain an indicator of the gains or losses of the currencies that are currently moving (selling). For this reason, the SOPR is a local signal indicator, which only takes into account the spent currencies changing UTXO and indicates whether the currently active sellers are making profits or losses.2. Consider the on-chain metrics-- Relative Unrealized Profit/Loss & SOPR, from any reliable source(Santiment, Glassnode, LookintoBitcoin, Coinmetrics, etc), and create a fundamental analysis model for any UTXO based crypto, e.g. BTC, LTC [create a model to identify the cycle top & bottom and/or local top & bottom] and determine the price trend/predict the market (or correlate the data with the price trend)w.r.t. the on-chain metrics? Examples/Analysis/Screenshot?
Relative Unrealized Profit/Loss
Due to Glassnode and Santiment restrictions regarding current RUPL data I will use for the indicator analysis alone the Look into Bitcoin page. I have chosen Bitcoin (BTC). For my fundamental analysis, I will take into account 3 years.
Image taken from: Source
RUPL & MVRV
As we saw in class the RUPL indicator can work in conjunction with the MVRV indicator to detect cycle tops. This time I will use the Glassnode platform. Through this platform, I can join in a single chart the BTC price together with the two indicators RUPL and MVRV. Bitcoin (BTC) 3 years analisys.
Image taken from: Source
However we see that at no time does the RUPL exceed the 75% line, so it is not a Top cycle. In other words, the uptrend still continues.
SOPR
In this case I will again use the data from Glassnode platform. Bitcoin (BTC) 3 years analisys.
Image taken from: Source
3. Write down the specific use of Relative Unrealized Profit/Loss(RUPL), SOPR, and MVRV in the context of identifying top & bottom?
2-The SOPR Indicator Indicates the gains or losses of currencies that moved e certain period, therefore it helps us to visualize and establish buy and sell zones (temporary) based on the price of the asset during bullish or bearish phases, In other words, the tops and bottoms of the SOPR indicator are local (swing points) and are a function of the current trend, not the total history of the asset.
When the indicator shows a peak away from the level of 1 upwards, this is a sign of a local high where holders sell and take profits so a pullback in the price is expected before continuing its upward movement. On the other hand, when a spike away from the 1 down level is seen, this is a sign of a local low where holders sell at a loss.In fact, the SOPR indicator does not serve to detect cycle or historical tops or bottoms. For this reason, the local highs and lows shown by this indicator do not function as buy or sell signals as they do in the RUPL indicator.
If you want a buy or sell signal on this indicator you should pay attention to when the line moves around 1 and the price is in a marked uptrend (buy signal) or downtrend (sell signal). 3-Finally the MVRV indicator as seen in past classes through its upper thresholds and lower thresholds identifies market highs and lows, or in other words overbought and oversold zones. Although both signals serve in theory to identify cycle tops and bottoms, in practice both signals do not have the same reliability. For example, historical lower thresholds have shown great reliability in identifying oversold areas at historical lows. On the other hand, the upper thresholds are less reliable signals as it does not always represent a cycle top but a price correction, especially if the upper threshold MVRV is below 200% and 300%.For an upper threshold to indicate a true cycle top it is recommended that it be above 300%.This effect is entirely psychological, since when an upper threshold occurs a certain group of traders sells their assets mistakenly believing that the uptrend came to an end. This naturally causes the price to correct, which can be taken by other traders as a buy signal... which in turn causes the main uptrend to resume. > Source